


Are you struggling with decreased work efficiency due to writing research reports? Are you finding it difficult to focus on core tasks because a marketing report takes two weeks to complete?
Many marketing professionals have reached out saying, "I don't know the systematic process for writing marketing reports," or "I need a standardized market research report template, but how should I build one?" Although data collection and analysis are completed within a week, in reality, three times the resources are invested in documentation.
If you are trying to solve productivity issues caused by repetitive report writing tasks, you might consider adopting an AI-based document automation solution.
Today, we will explore how to optimize the research report writing process and improve work efficiency by 90%! We will systematically examine everything from specific strategies that reduce two-week processes to just two hours, to the use of each platform such as Inline AI, Perplexity, GenSpark, and Napkin AI.
If quarterly research reports are burdensome, consider custom automation for in-house templates
Collect the latest data with Perplexity, and perfect our company style with Inline AI
You may be surprised when you get a quote from an industry research firm. Here's how a typical quote looks:
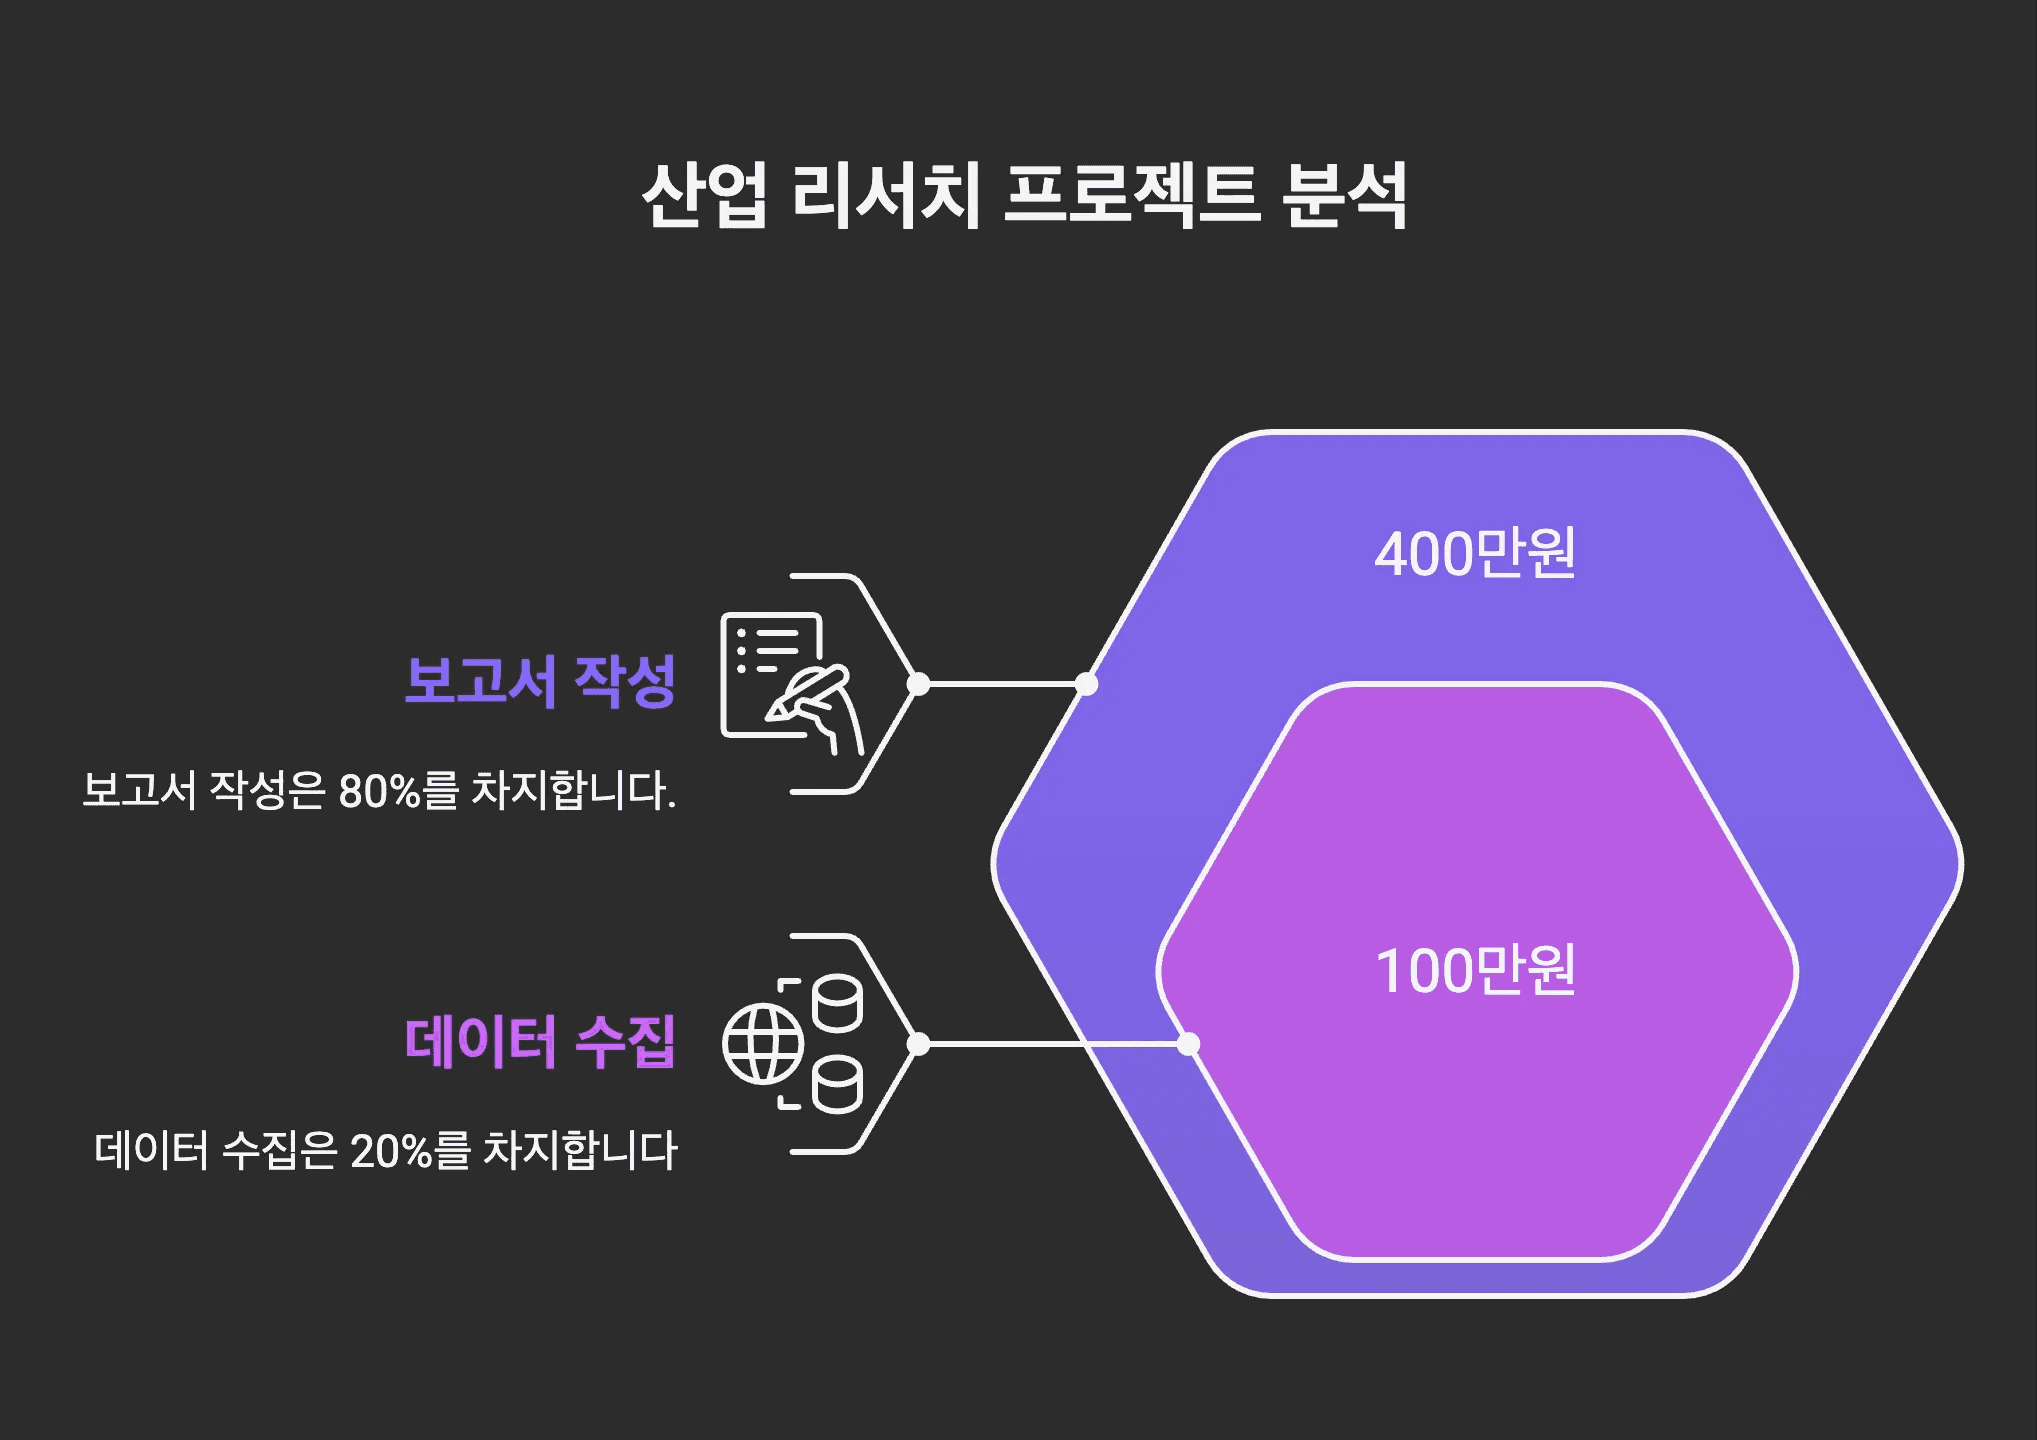
More resources are being spent on report writing than on data collection.
80% of the cost of trend reports or corporate analysis projects lies in 'report writing and data interpretation.' In contrast, actual marketing data analysis or survey execution takes up only about 20%. Why is this the structure? Looking at the market research report writing methods of professional research firms gives you the answer. A senior analyst conducts industry analysis, a junior researcher creates charts, and an editor refines the document. The personnel costs involved in this process are significant. However, by utilizing AI tools like Perplexity and Gemini, much of this process can be automated.
Specific usage:
Perplexity: Search terms like "K-Beauty market size and growth rate in 2024" for real-time current data and sources
Gemini: Specializes in analyzing long documents, making it useful for summarizing or reorganizing existing reports or papers
Inline AI takes it a step further. It completely solves the "bother of adjusting to new templates every time", which is key in repetitive quarterly report writing:
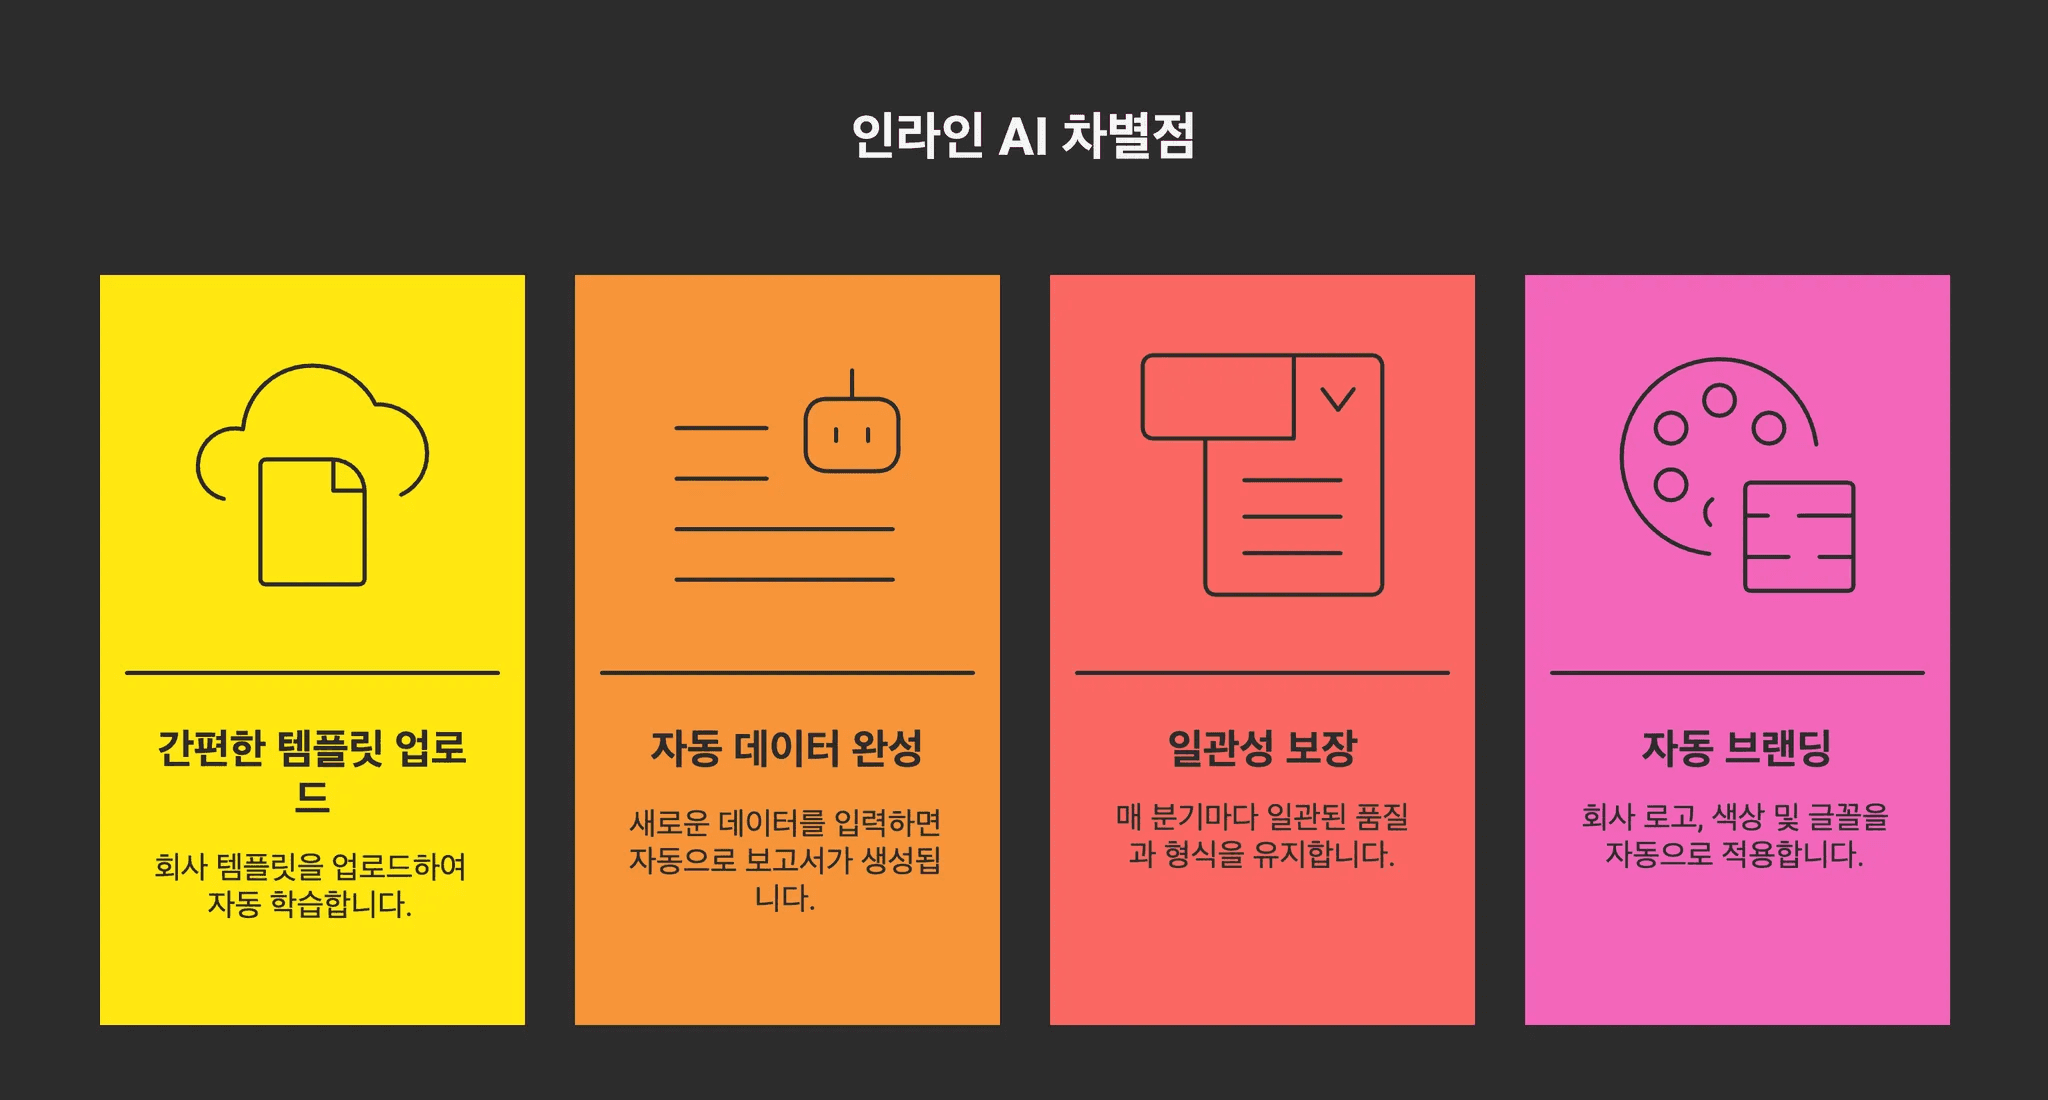
Differences unique to Inline AI:
One-time upload of company template: Upload the existing quarterly report once and it automatically learns your company's unique style, branding, and structure
Just input the data for auto-completion: Automatically generate a finished report that fits the existing template by simply entering new quarterly data
Consistency ensured: Even if different people write for each quarter, consistent quality and format are maintained
Automatic branding application: Company logos, colors, and fonts are automatically applied so it looks like "a real company report"
Actual usage scenario:
1Q job: Upload last year's 4Q report as a template (only once)
From 2Q: Automatically complete with the same format by entering only new data
3Q, 4Q: Consistently generate reports by continuing to change only the data
While other AI tools generate "generic reports that need to be created anew each time,"
Inline AI provides "a customized automation system you can continue using once set up."
💡 Are quarterly reports a burden for you? Explore AI document automation solutions
"Where do I even start with a blank sheet?" Difficulty in structuring
Learn company templates with Inline AI and gather global data with Perplexity
Having solved the quarterly report writing burden, let's now examine the second concern of "where to start on a blank sheet." Practical workers writing a research report for the first time often struggle with this "blank page syndrome." They have trend report data but don't know what order or structure to use.
Inline AI fundamentally resolves these issues. It can automatically create "our company's unique report template" by learning from the company's existing report samples. For example, if you enter "Market reaction survey before new product launch," it suggests the following structure tailored to the company style:
Survey overview and purpose
Industry status analysis
Target customer segmentation
Positioning against competitors
Price sensitivity analysis
Marketing strategy proposal
Risk factors and countermeasures
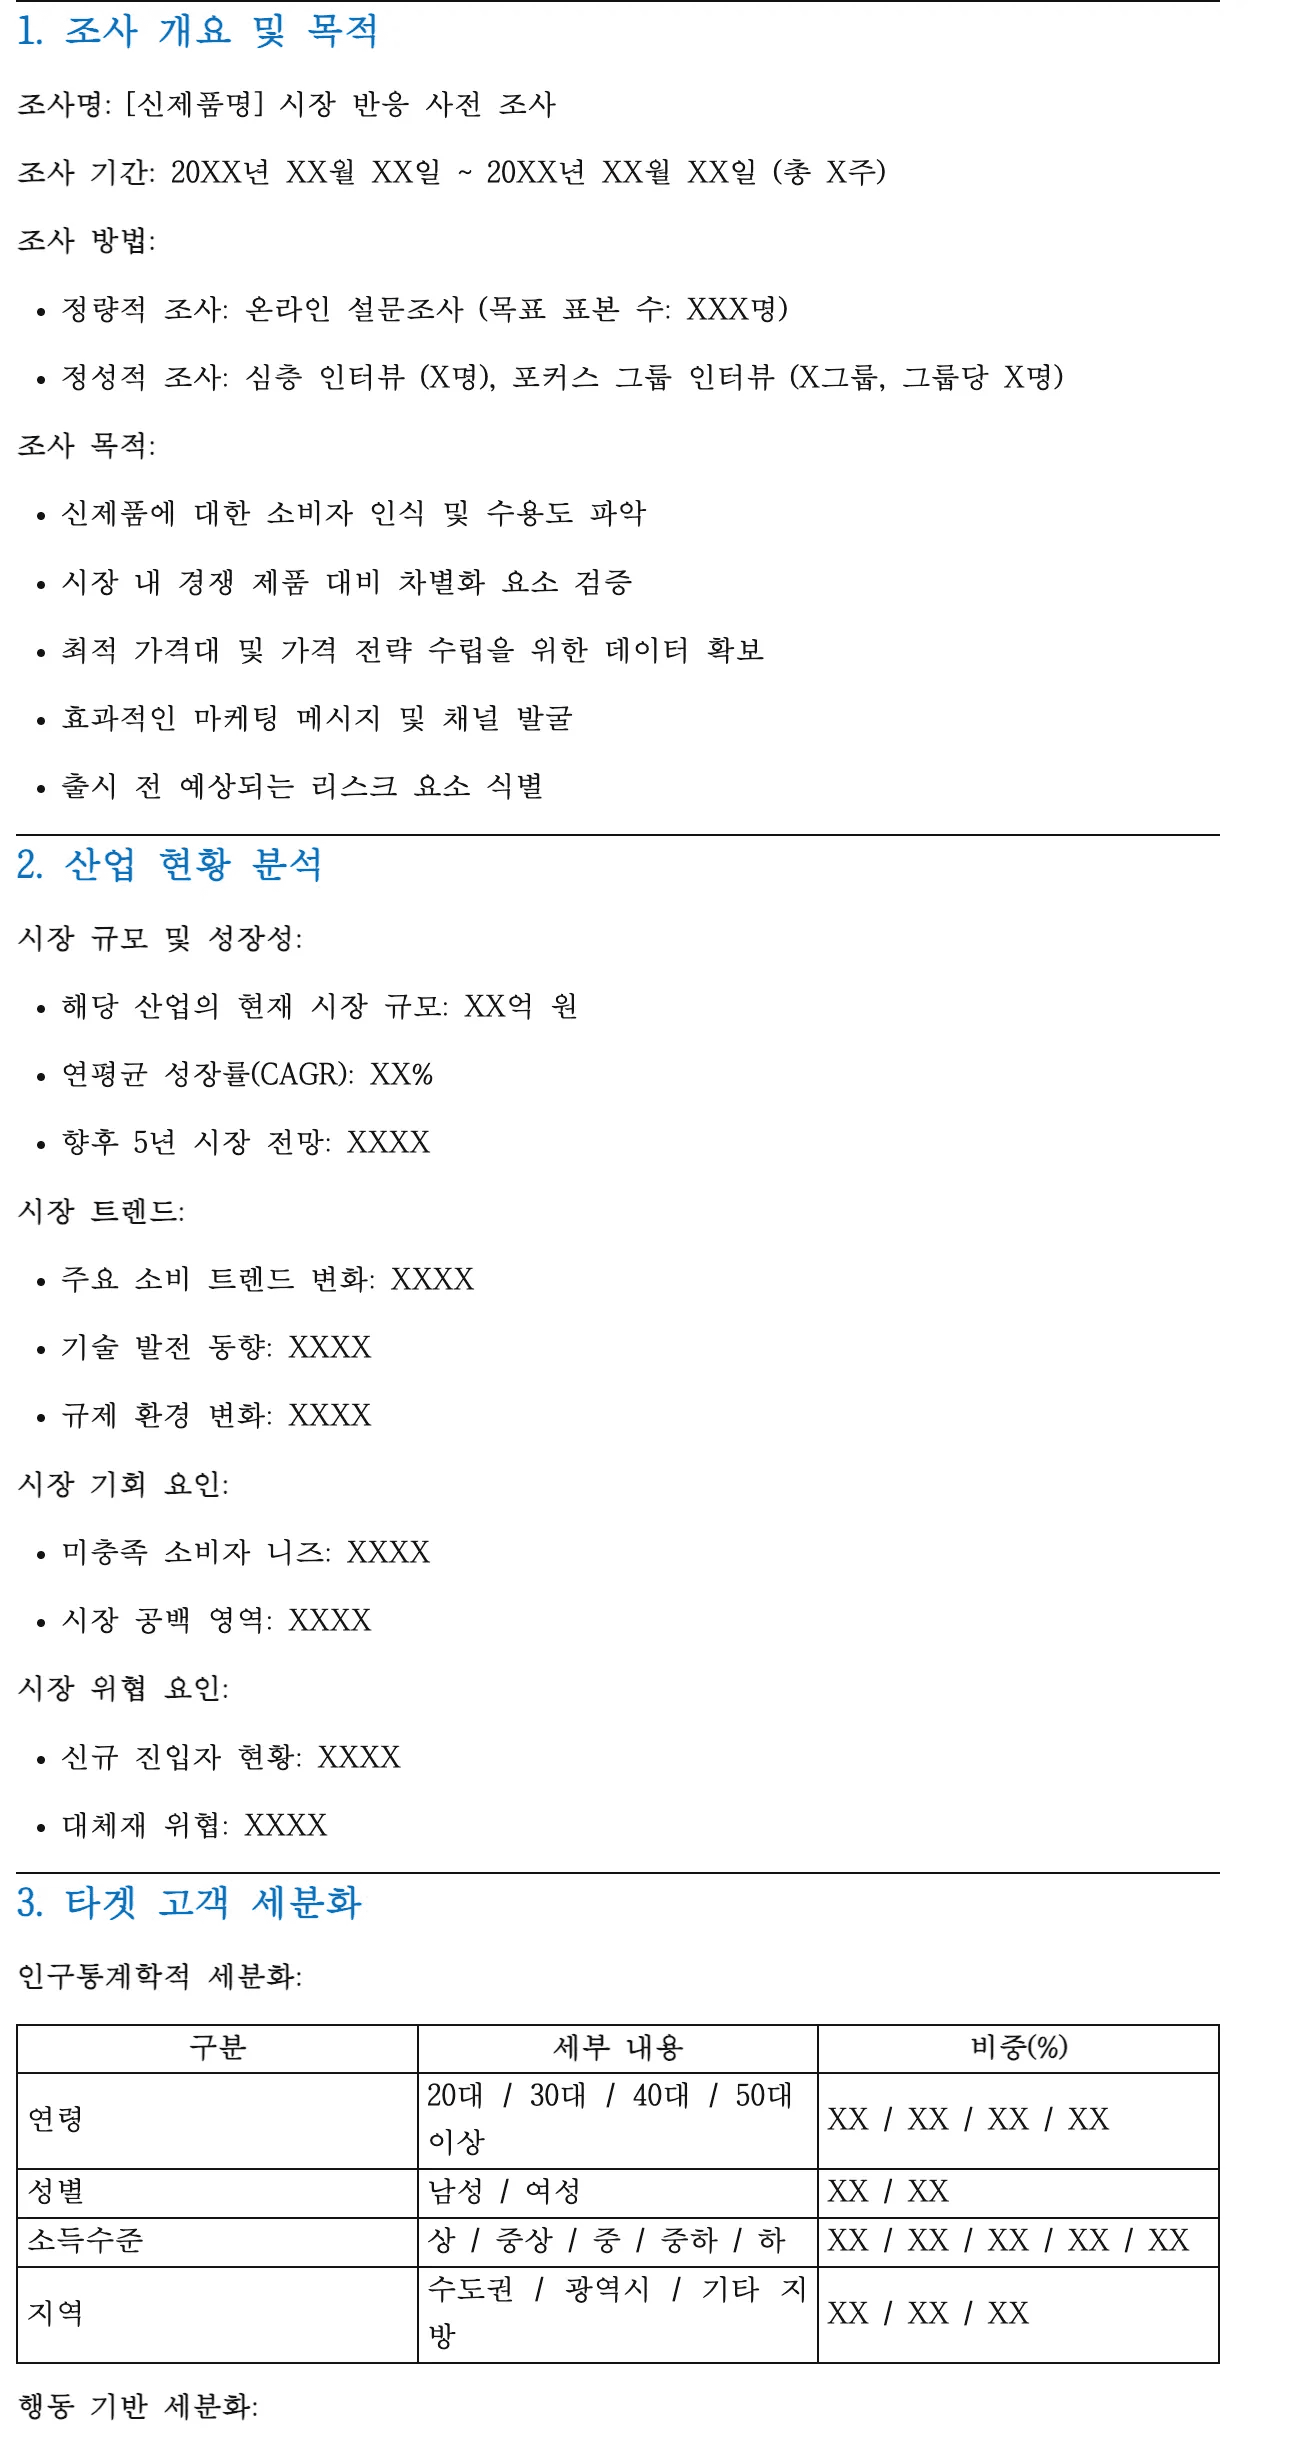
→ This is a research survey template created in 5 seconds by Inline AI.
If global data is needed, using Perplexity or Gemini is also effective:
Perplexity: Searching like "2025 global K-beauty market trends" provides the latest overseas market data and reliable sources
Gemini: Specializes in multi-country market analysis or global trend comparative analysis
Guidelines on what content to include in each section allow even beginners unfamiliar with market research report writing to create a report structure at an expert level.
If it takes two weeks to write a report, cut the time by 90% with AI
Use Genspark for structuring and Inline AI for step-by-step automation
"Data analysis is quick, but writing the report takes another two weeks." You've likely made this complaint at least once. Especially when a quarterly end or an important presentation is approaching, time feels even more pressing.
The time pressure marketers actually face:
"I need to complete the report by tomorrow, but I'm not even halfway through."
"It takes half a day just to make one chart."
"I waste time adjusting templates each time."
"It takes over a week just for review and revision."
In this situation, overtime work seems inevitable. But does it have to be this way?
Let's look at the differences between traditional methods and AI utilization:
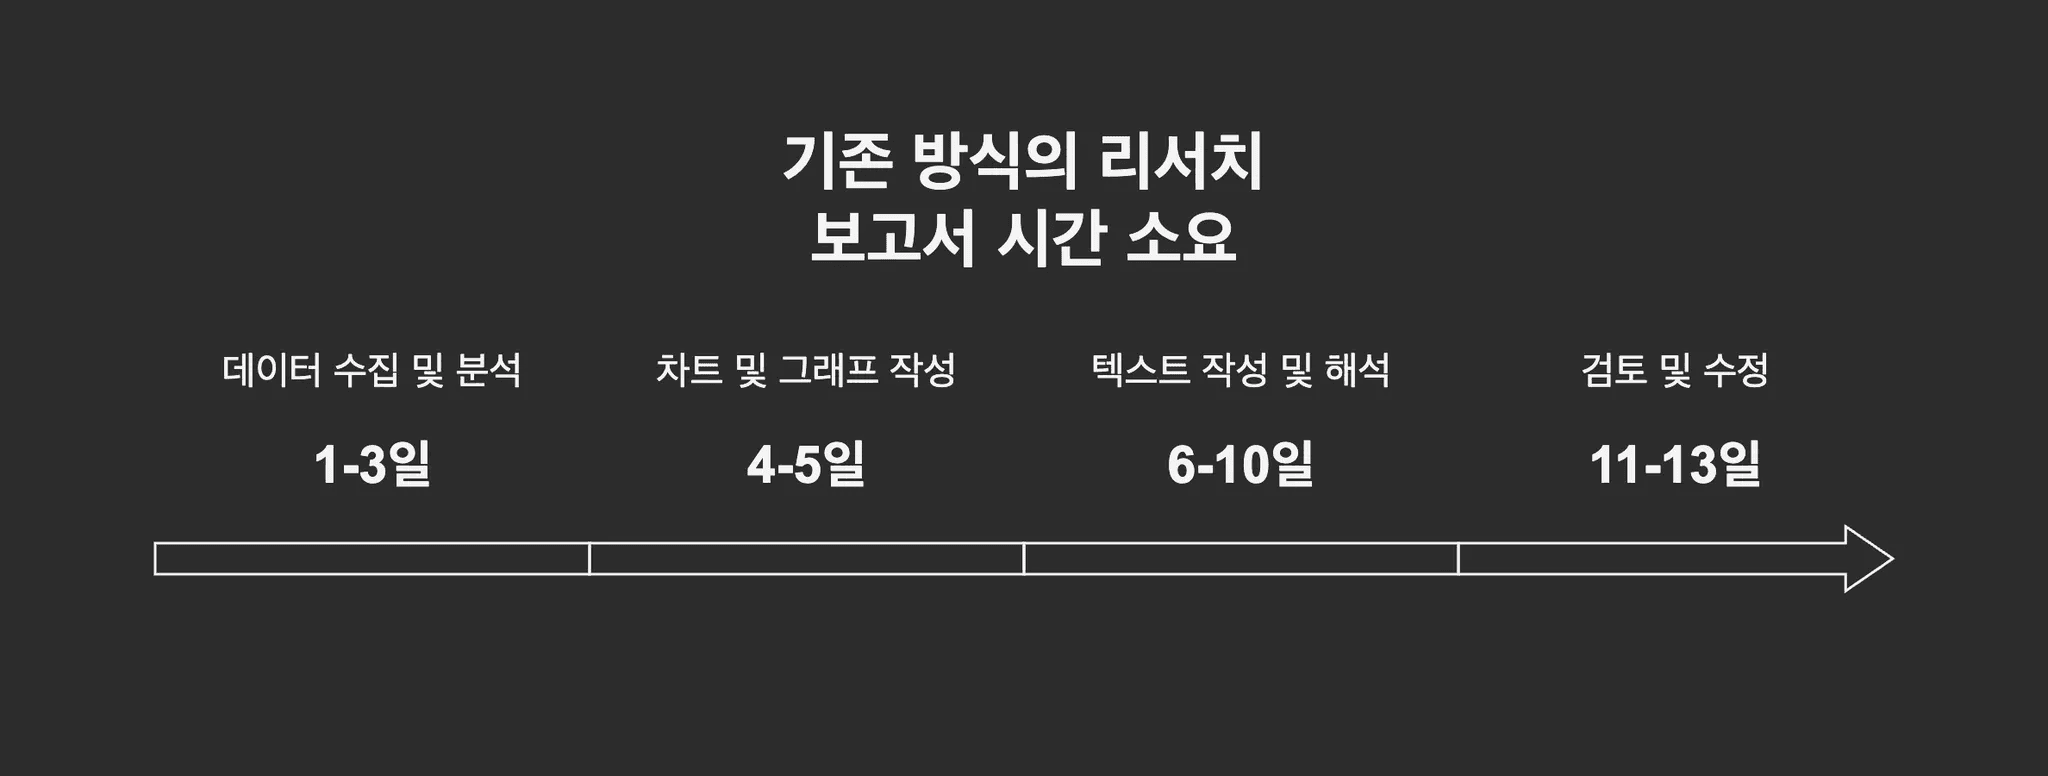
Ultimately, work that took two weeks is shortened to two hours.
Specific usage method:
Stage 1: Quick structure design with Genspark
Search for "Market Research Report Outline" to instantly check industry-standard structures
Compare various report templates to choose the most appropriate form
Analyze competitor report styles simultaneously
Stage 2: Implement automation with Inline AI
Automatic placement of introduction-body-conclusion structure: No worries about logical flow
Automatic priority sorting of key insights: The most important content comes first
Automatic application of company format: No need to format anew each time
Automatic linking of charts and text: Generate natural graph explanations
Stage 3: Experience of actual time reduction An IT startup marketing team using Inline AI completed a "B2B SaaS market trend analysis report," which used to take two weeks, in one day. The team leader mentioned, "Now we can focus more on strategy development in the time saved from report writing."
🚀 Interested in reducing 2 weeks to 2 hours? Try it now
If you want to write according to the in-house style, create custom AI reports
Inline AI distinguishes between CEO and Staff versions automatically
Even with the same marketing data analysis results, the format required varies by company and audience. The industry report viewed by a CEO should be entirely different from the trend report seen by working-level staff.
Inline AI reflects these differences automatically. When the same data is input, it generates corporate analysis reports with different structures and tones according to the audience and company format:
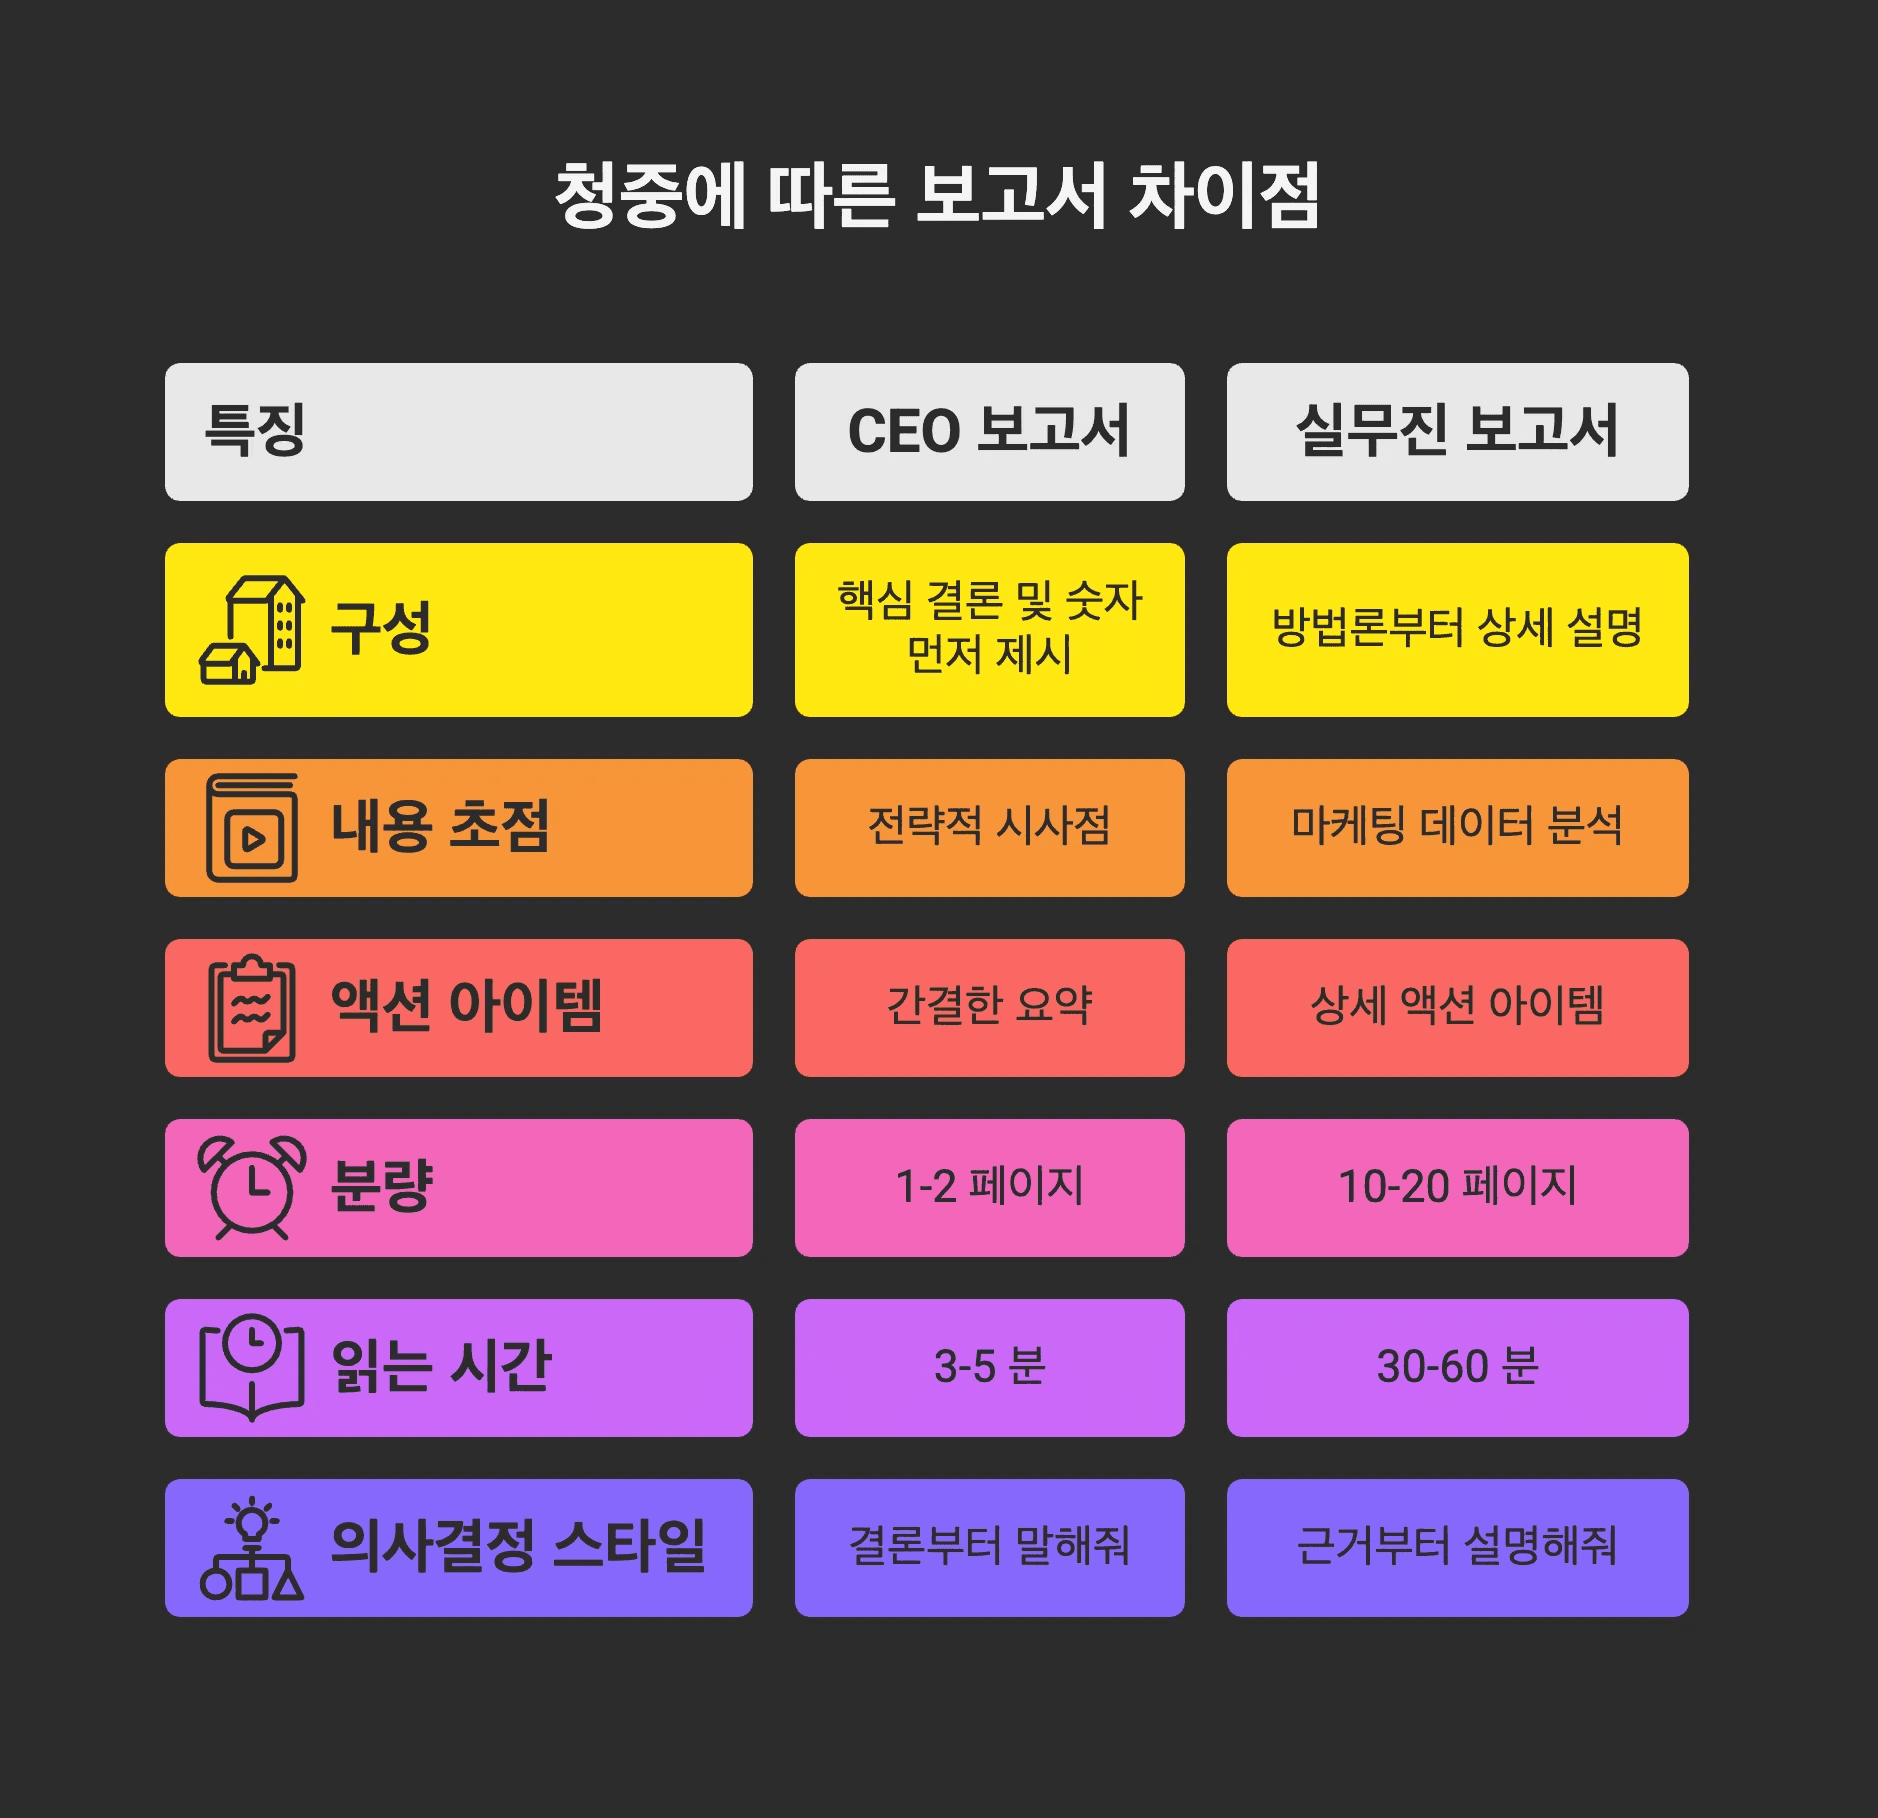
Thanks to this customization feature of Inline AI, there is significantly less feedback like "Please rewrite the marketing report".
Especially, with the increasing availability of tools that can teach proprietary report templates or branding guidelines, it has become possible to automatically generate reports that truly represent "our company style."
If turning data into a story is difficult, use AI storytelling tools
Create a story with Inline AI and complete visualization with Napkin AI
How can you turn the stern statistic that "67% of Gen Zs prefer eco-friendly products" into a convincing narrative? This is where many marketers struggle.
Inline AI excels at converting such marketing data analysis results into natural stories:
Traditional Method (Before):
"Survey results showed that out of 500 respondents, 335 (67%) expressed willingness to purchase eco-friendly products."
Stern listing of numbers
Simple data reporting
Lacks insight
AI Storytelling (After):
"Seven out of ten Gen Z consumers have already made eco-friendliness a key criterion for product selection. This is not a mere trend but signifies a fundamental shift in consumption patterns. Especially noteworthy is that they are using multiple eco-friendly brands, making eco-friendly positioning no longer optional but necessary."
Convincing story
Strategic insight provision
Actionable conclusion
By employing AI storytelling, even the same dataset can create entirely different value. It shifts from a mere enumeration of numbers to a narrative filled with context and meaning, transforming the report from a "document to be read" into a "strategic guide you want to act on." Particularly for executives or decision-makers, it clearly conveys the business implications behind the data, significantly enhancing the practical utility of the report.
📊 If you want to turn data into a story, Explore AI Documentation Solutions
Napkin AI fully automates the visualization task
The creation of charts or graphs included in a report is also a time-consuming task, but Napkin AI revolutionizes this issue.
Key features of Napkin AI:
Automatic chart generation from text input: Enter "67% of Gen Z prefers eco-friendly products" to automatically generate an appropriate graph
Automatic recommendations for various chart types: Suggests the most suitable format among pie chart, bar graph, infographic
Brand-customized design: Automatically generates visual materials in line with company colors and fonts
Infographic style: Creates visual content with storytelling, not just simple charts
Actual usage example: Previously, a three-step process of "creating a chart with Excel → transferring to PowerPoint → modifying the design" was required, but with Napkin AI, it is reduced to "data input → completed instantly".

Napkin AI is especially specialized in data storytelling. It visually emphasizes the number 67% while simultaneously delivering the intuitive message of "7 out of 10" with an infographic.
The more crucial element is that it automatically presents clear action items in response to the question "So what should we do?". With the automatic generation of natural explanations connecting graphs and text, research reports evolve from mere data listings to strategic guides.
If summary for presentations is a concern, extract only the core with AI
Utilize the summarization features of Claude and Gemini
If you have to present a 30-page industry analysis report in 3 minutes, many marketers feel stressed again. It is challenging to decide what content to omit and what to retain.
Claude and Gemini AI tools extract only the core from long trend reports to create a one-page summary. Furthermore, it can generate separate versions for 1-minute, 3-minute, and 5-minute presentations according to the presentation time.
A merchandising team at a distribution company used AI tools to make a 3-minute summary report for an executive board, receiving feedback such as "This was the most impactful report ever." The tools accurately extract the essential points needed for the presentation.
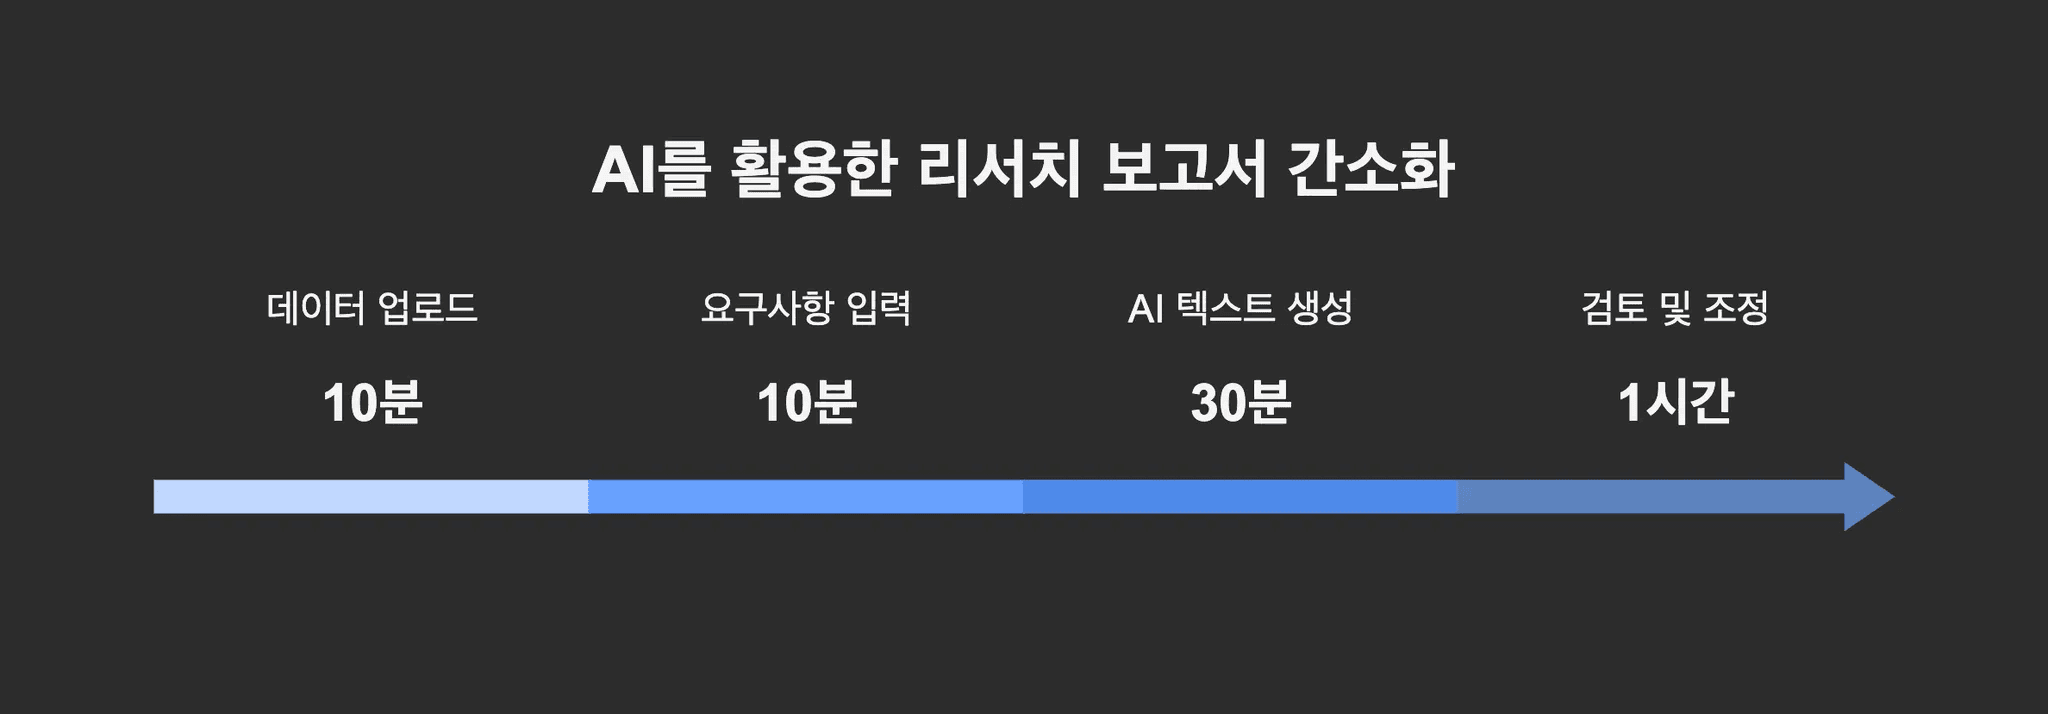
A complete guide to completing a research report in 2 hours
We've looked at the key pain points marketers face and solutions so far. Now, let's understand the actual process of how to utilize these:

The market research reports created through this process match the quality of those provided by existing outsourcing firms. In terms of data interpretation accuracy and the ability to derive actionable insights, it often receives higher praise.
A fashion brand used Inline AI to complete a consumer lifestyle trend analysis in 2 hours, to the amazement of the entire marketing team. "Such quality can actually come out in just 2 hours," they said, noting they can't work without AI now.
Stop working overtime for report writing!
We've explored AI-based research report automation methods in detail.
The days of marketers worrying "The marketing data analysis is done, but the report is problematic" are now in the past. From Claude and Perplexity to Genspark, Napkin AI, and Inline AI, various AI tools enable anyone to complete a professional-quality industry research report in just 2 hours.
The burdens of repetitive quarterly tasks, the two-week writing duration, and the bewilderment of not knowing the marketing report format are all resolved. More importantly, marketers can now spend more time on data analysis and strategy development than learning how to write market research reports. AI document automation is not just a time-saving tool; it is a game-changer that changes the way marketing teams work.
Especially, Inline AI offers powerful features that differentiate it from other AI tools. By uploading your company's existing reports, it automatically learns the unique style, branding, and tone to create reports that look like "they were truly made by our company." Each quarter, by simply entering the new data, a completed report matching the existing format is automatically generated. No more wondering "Who will write this quarter's report?" or wasting time adjusting formats. Inline AI remembers the style unique to your company.
Whether for trend reports or corporate analysis, stop working overtime because of report writing. Inline AI will help you focus your time and energy on more valuable tasks 🙂
📋 Get started now!
Want to be free from outsourcing costs of 5 million won and the stress of two weeks of overtime?
✅ Free to use
✅ Guarantees expert-level report quality
✅ Accessible 24/7
Recommended related articles
👉 Repeated document tasks, achieve 10x speed with Inline AI.
👉 Recommended AI for reports - AI that writes in Word report format as is (+prompt provided)


