Blog
How to Calculate Standard Deviation in Excel: Choosing the Right Function and Reading the Results

Standard deviation summarizes how spread out your data is around the average. A larger standard deviation means values vary more. A smaller standard deviation means values cluster near the mean.
The calculation is easy in Excel. The hard part is choosing the right function and interpreting the result correctly.
What Standard Deviation Means
Standard deviation is most useful when paired with the average. Two teams can have the same average sales but very different consistency. The team with lower standard deviation is more stable.
Use standard deviation to analyze revenue volatility, defect rate consistency, survey score distribution, or workload balance.
STDEV.P vs STDEV.S
The key question is whether your data is the whole population or only a sample.
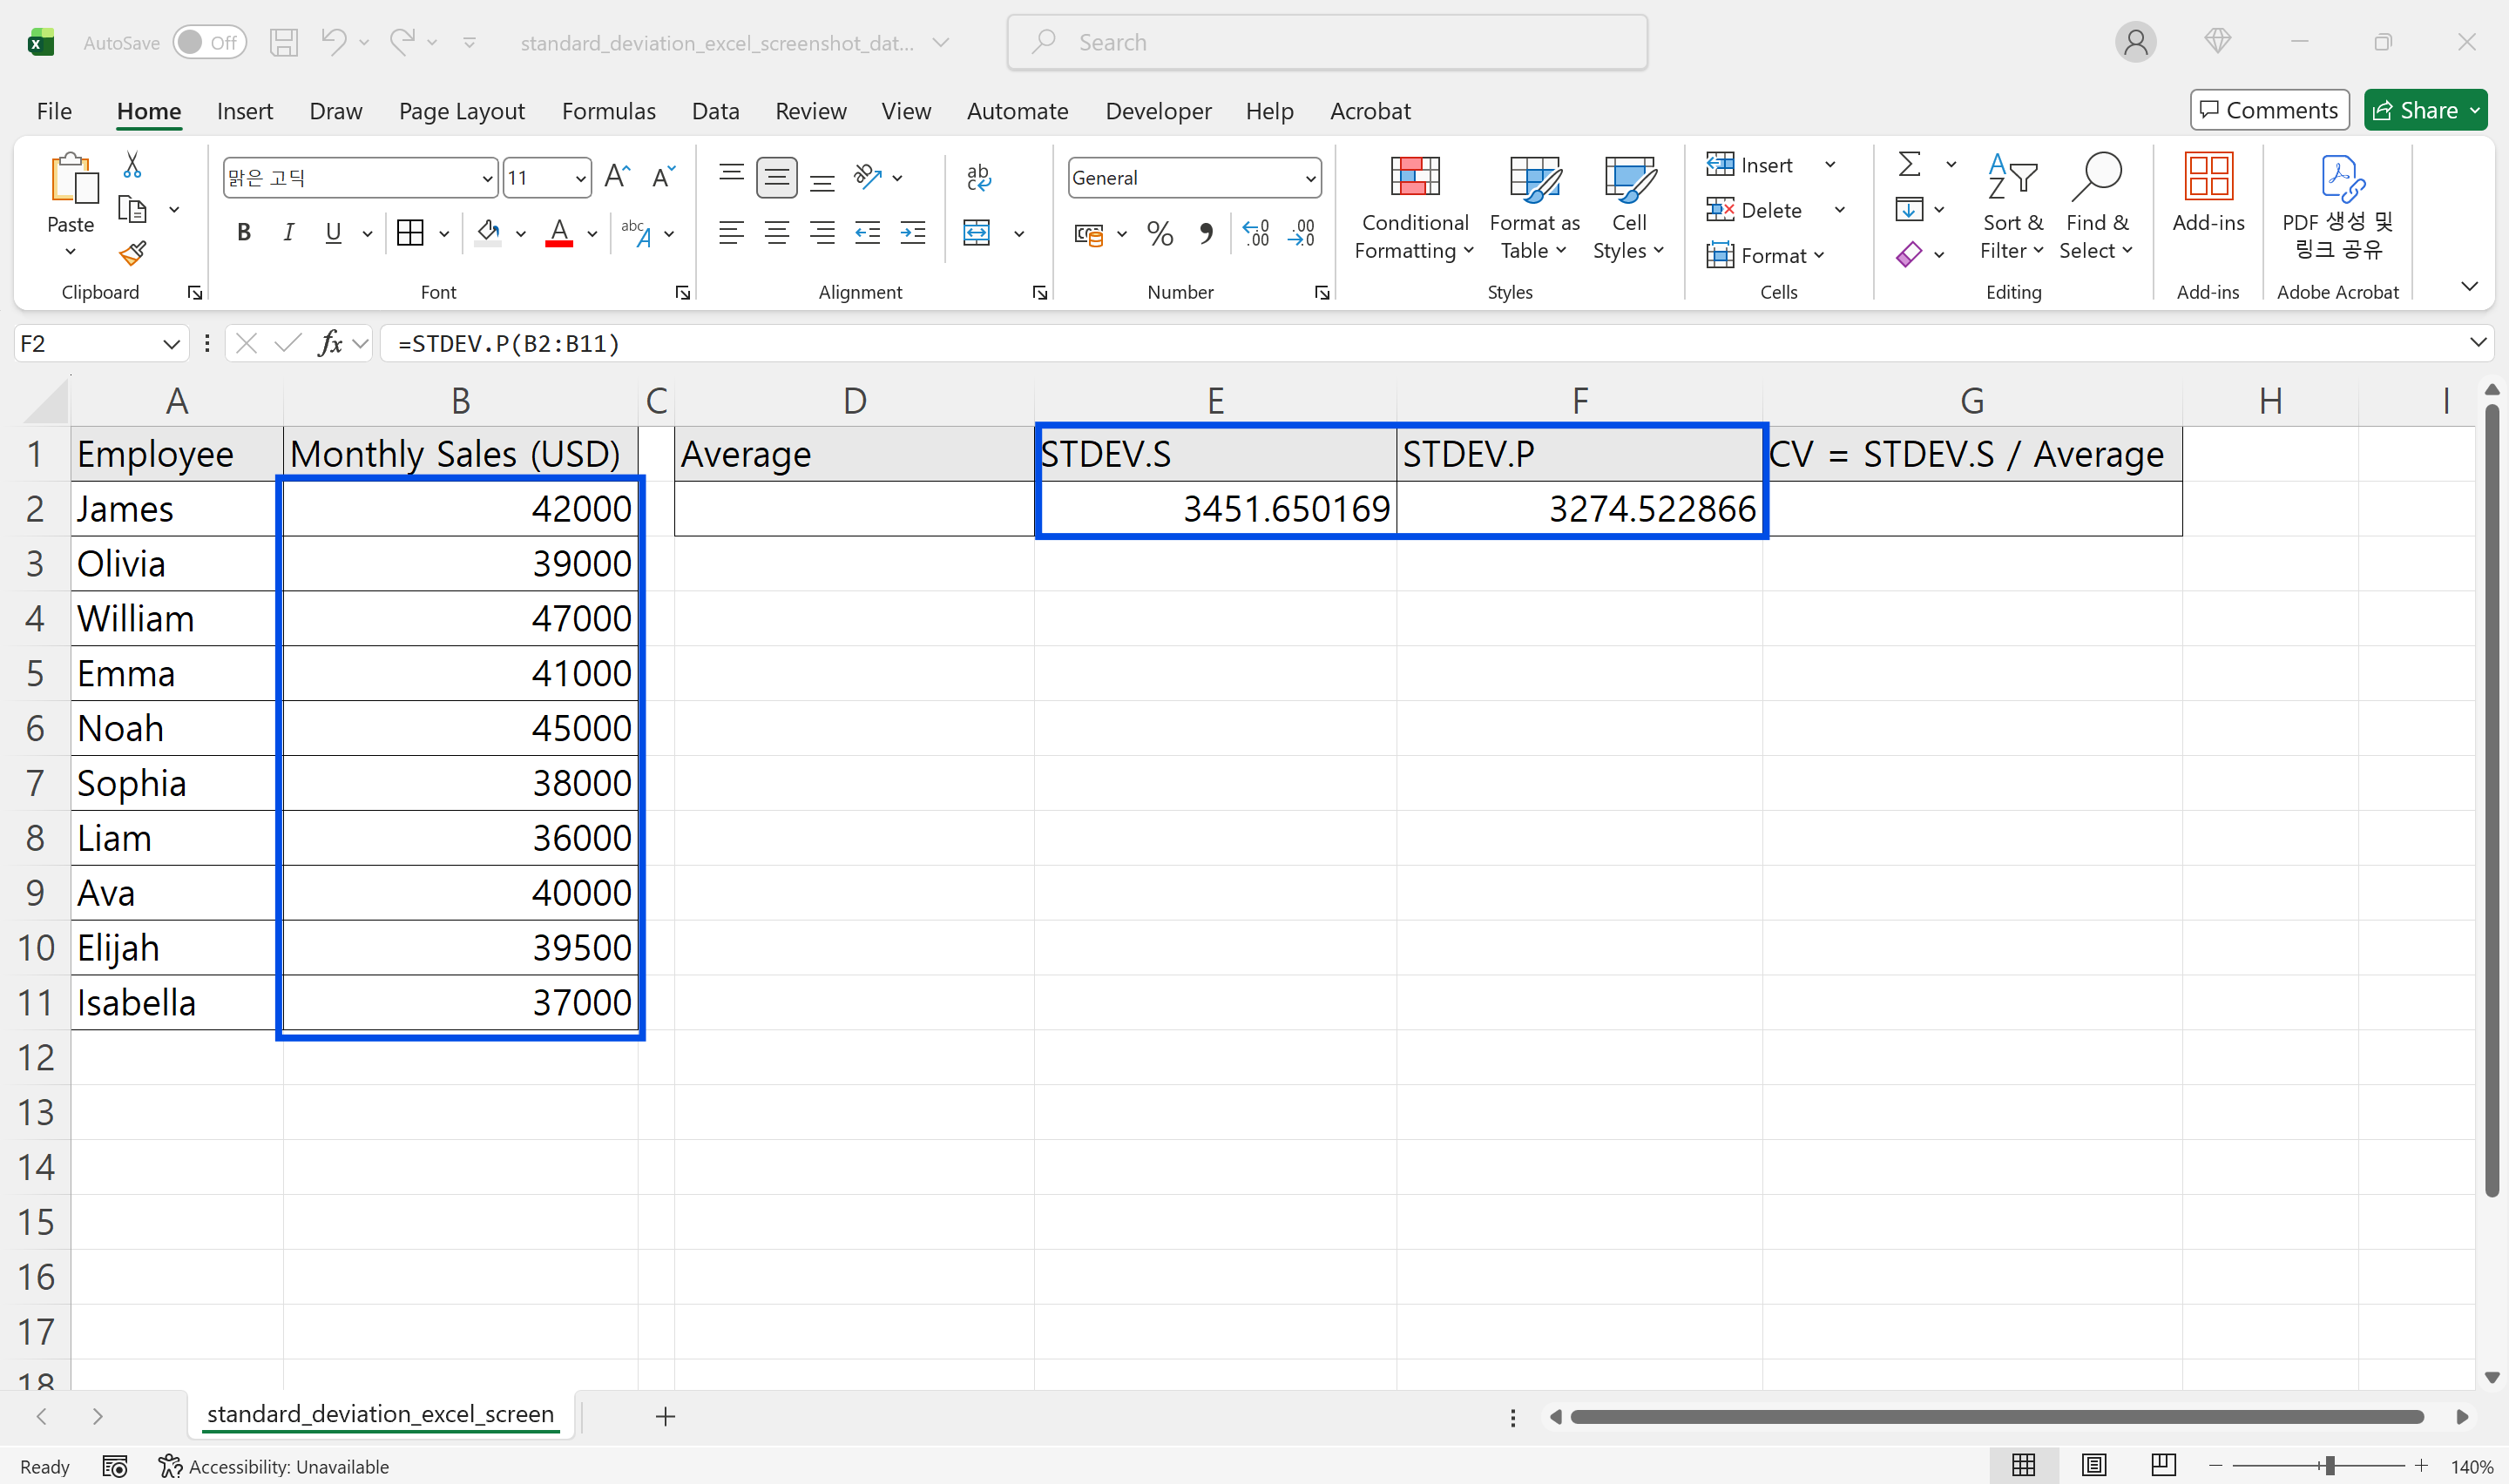
Use STDEV.P when the data contains the full group you care about. For example, if you have every sales record for a completed quarter, STDEV.P is appropriate.
Use STDEV.S when the data is a sample from a larger group. For example, if you survey 300 customers out of a much larger customer base, STDEV.S is appropriate.
In business analysis, STDEV.S is often the safer default because many datasets are samples.
How to Calculate Standard Deviation
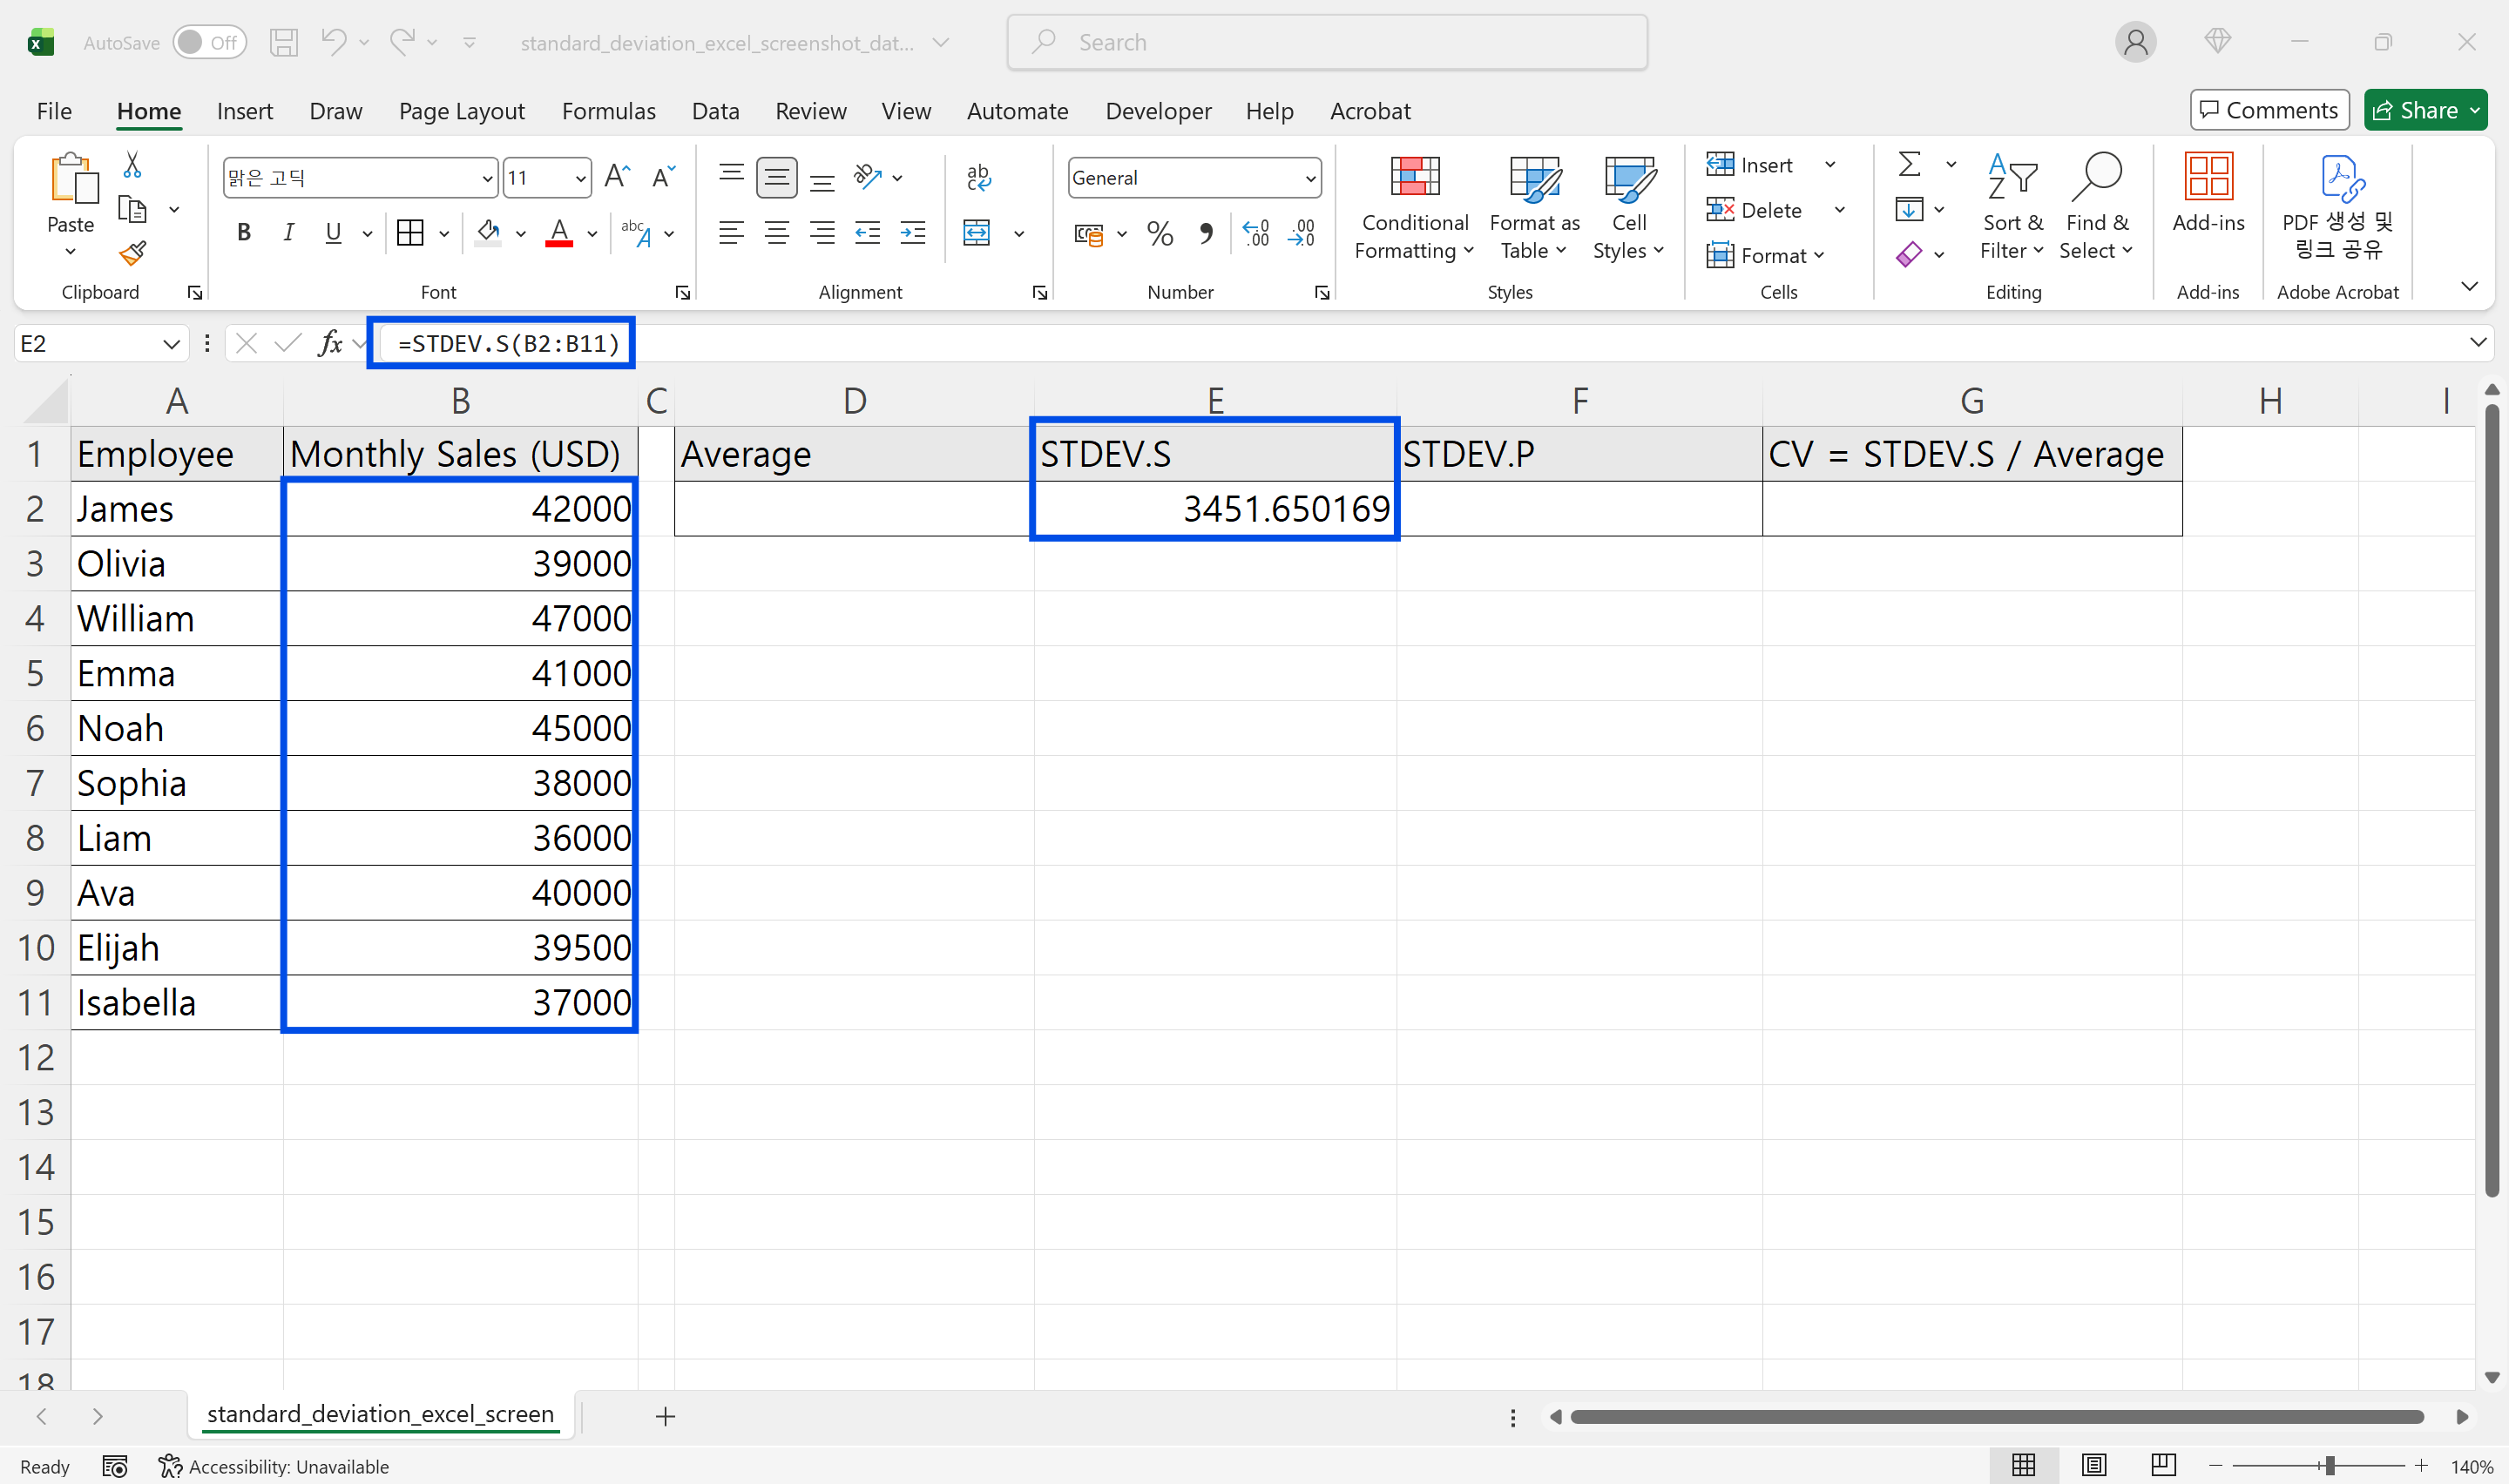
Click the result cell, type =STDEV.S( or =STDEV.P(, select the numeric range, close the parenthesis, and press Enter.
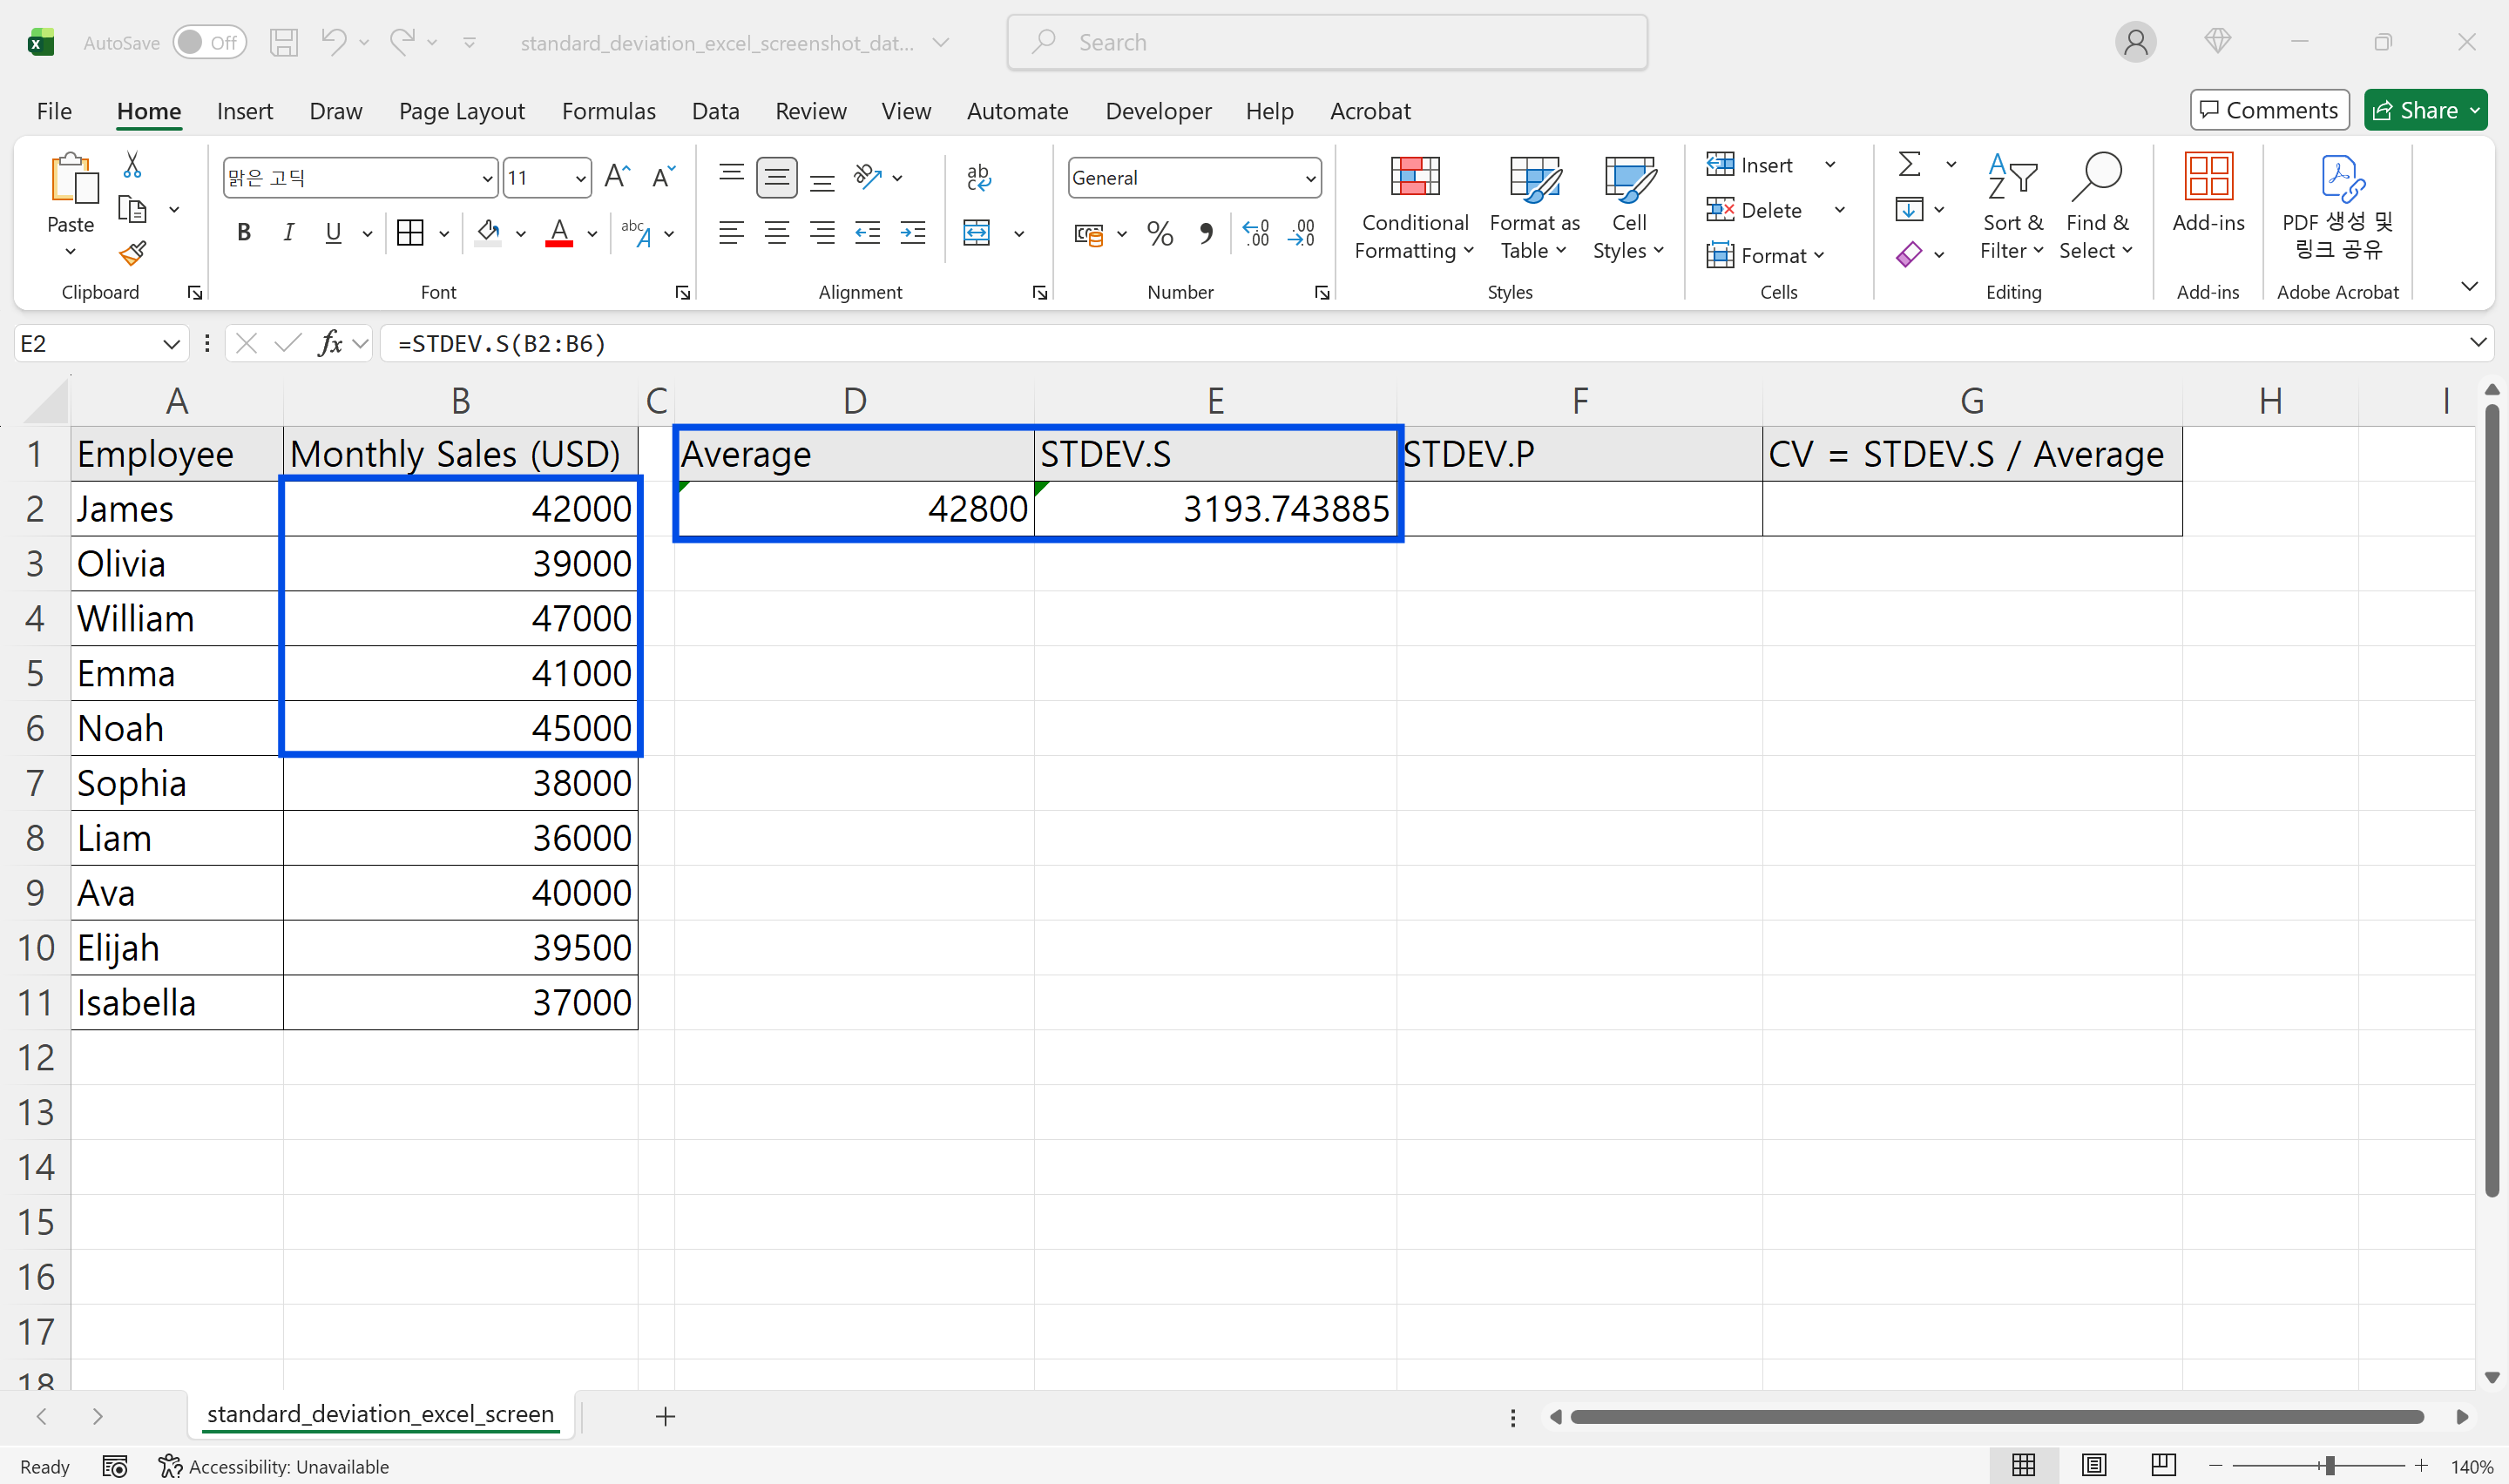
Place AVERAGE next to the standard deviation so the spread has context. Empty cells and text are ignored, but numbers stored as text may be excluded.
Common Interpretation Mistakes
A high standard deviation is not automatically bad. New campaigns, seasonal periods, and experimental projects naturally create more variation.
Do not compare standard deviations across different units directly. Revenue dollars and handling time seconds are not comparable. Use coefficient of variation when comparing spread across different scales: standard deviation divided by average.
Do not mix STDEV.P and STDEV.S across similar reports. Small datasets can change noticeably depending on the function.
Practical Analysis Standards
Choose one function for each reporting context and document it. Pair standard deviation with average. Treat small-sample results as signals, not final conclusions. If you have fewer than 10 data points, one outlier can dominate the result.
FAQ
STDEV and STDEV.S return the same result in modern Excel. A standard deviation of 0 means all values are identical. Negative values do not break the calculation because Excel uses squared differences from the mean.
Make Statistical Analysis Faster with inline AI
Once you know how to calculate standard deviation in Excel, the next step is automating repeated statistical analysis. Wouldn't it be easier to stop checking function choices and cleaning data ranges manually across multiple sheets?
inline AI is a local agent that works directly inside Excel. Ask in natural language, such as calculate standard deviation in this Excel file, and it can read and edit your Excel file in real time.
Because it runs locally on your PC without uploading your data to the cloud, it can handle sensitive spreadsheets more safely. Download it today and experience the future of Excel work yourself.
Download your AI Coworker for Excel