

Loading...
Start with a demo built on your own data.
Book a demoSee what each customer really leaves you, and what eats into it, in one table. Try price and freight-recovery assumptions, then save the plan for the next terms discussion.
Costing: profitability by customer, Q3 2026
Contribution / 8 analyzed accounts
Weighted margin
Accounts analyzed
8Q3 2026
Analyzed net revenue
$5.74M8-account total
Loss-making accounts
1among 8 analyzed accounts
| Account | Contribution | Margin |
|---|---|---|
| $384K | 27.0% | |
| $220K | 20.0% | |
| $208K | 28.0% | |
| -$12K | -2.1% | |
| $63K | 20.0% | |
| $135K | 26.0% | |
| $57K | 14.0% | |
| $144K | 23.0% |
Northstar Markets
Peak Market
Harborview Hotels
Improvement scenario
27.0% / Efficient case pack
Current baseline
27.0%Modeled outcome
28.5%Recovery is applied to the cost gap between the current result and a 22% target margin.
Contribution < 0
Loss; margin under 22%Customers with negative contribution or under 22% margin are flagged.
The loss-making list reaches the owner and sales lead every month.
Change selling prices in bulk
AI applies price changes for low-margin customers right away.
This app was built by describing it. Answer a few questions and get an app you can use the same day, no developers needed.
Explore App builderI want to know how much we really make on each customer, and which ones lose money on freight or returns.
Found 3 ARP modules. A few questions first.
Which period's costs should it use?
Final quarterly costs, to compare actual profit
What comes out of contribution?
Cost of goods, freight, returns, promotional discounts
What's the target margin?
22%; anything below needs a plan
Your app is ready to use.
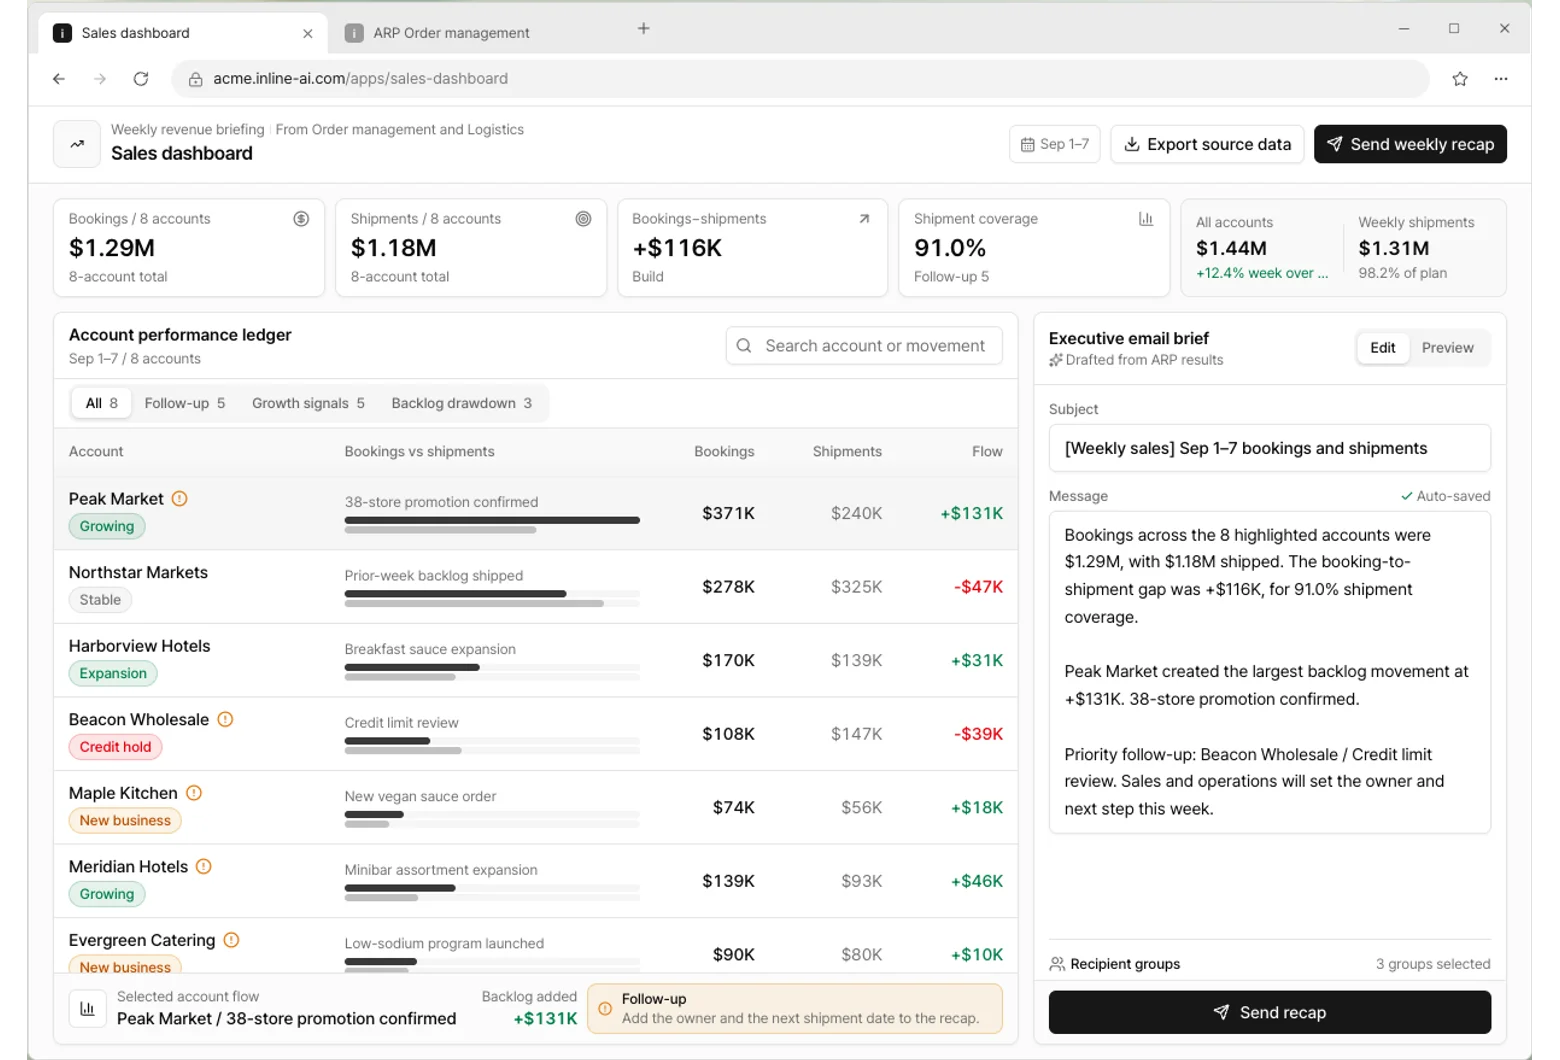
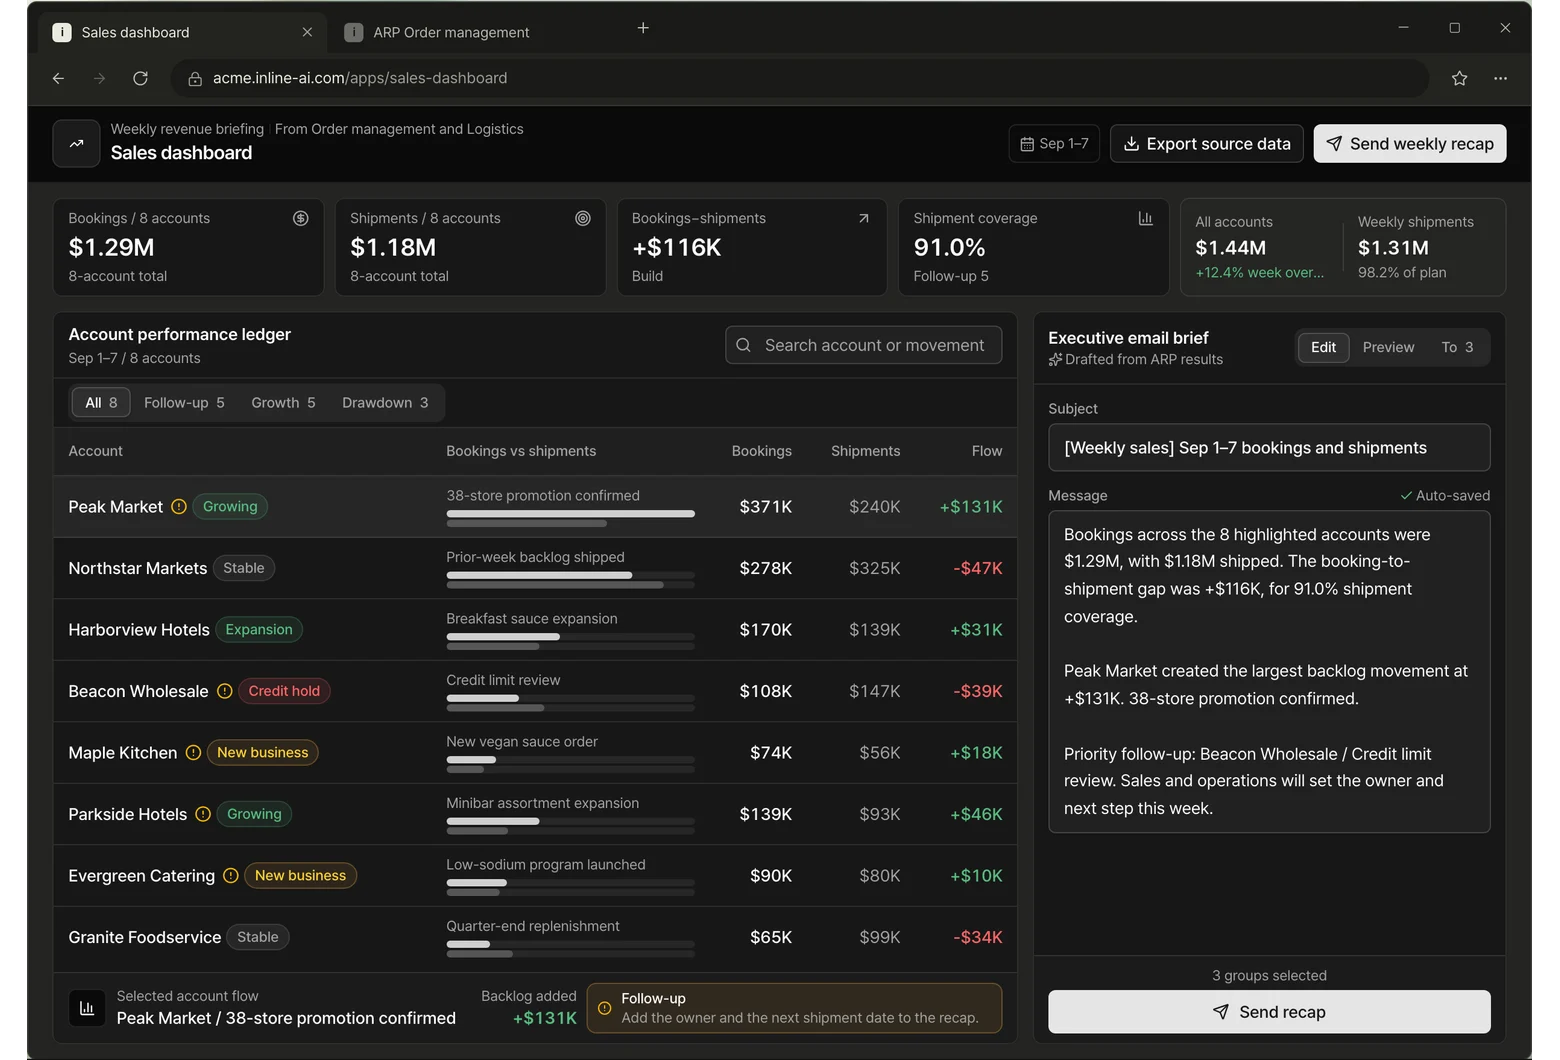
Last week's bookings and shipments by customer, plus the Monday recap email.
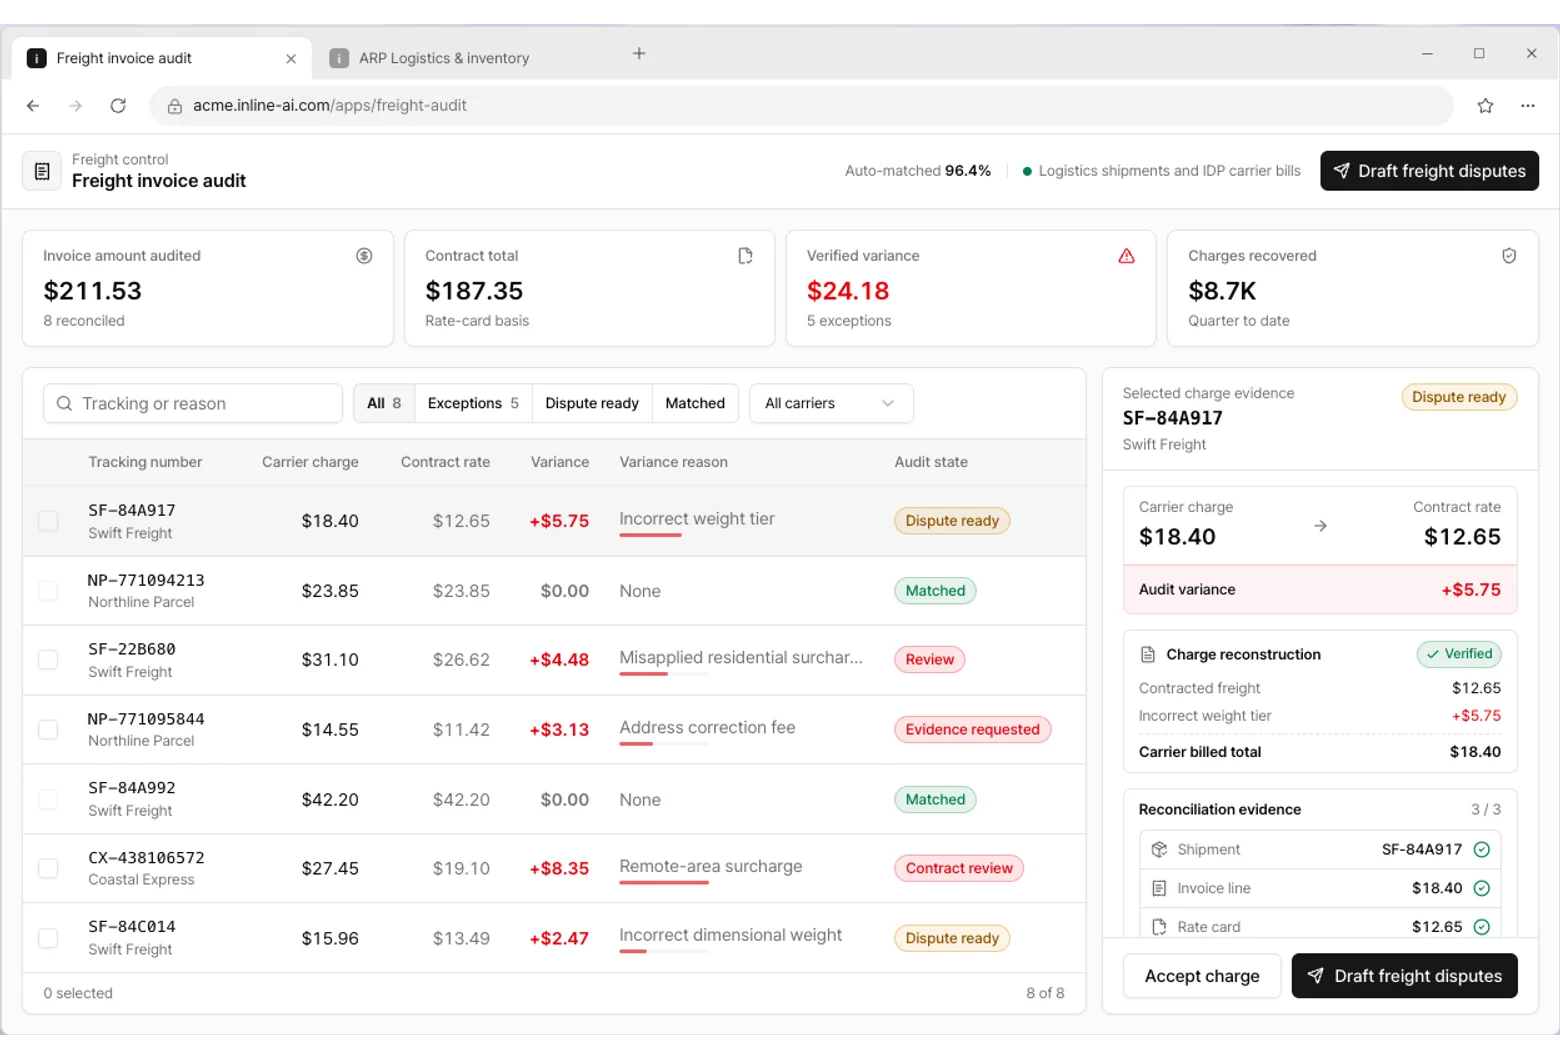
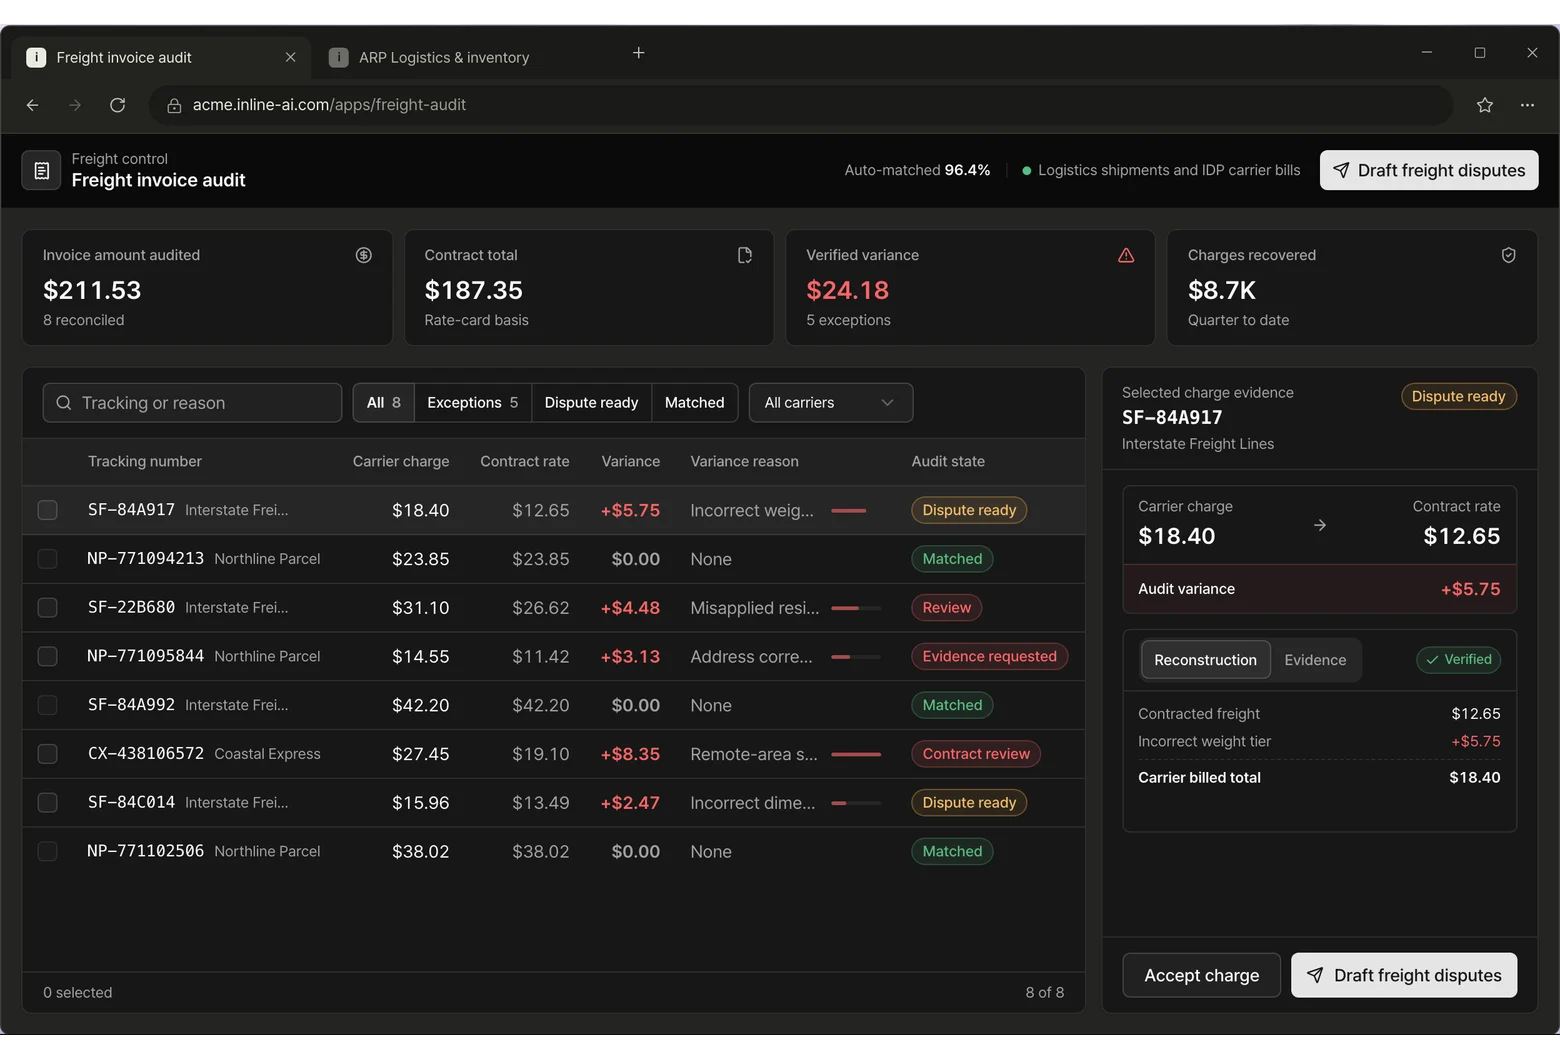
Match each carrier's monthly bill to the shipments you sent and catch overcharges.
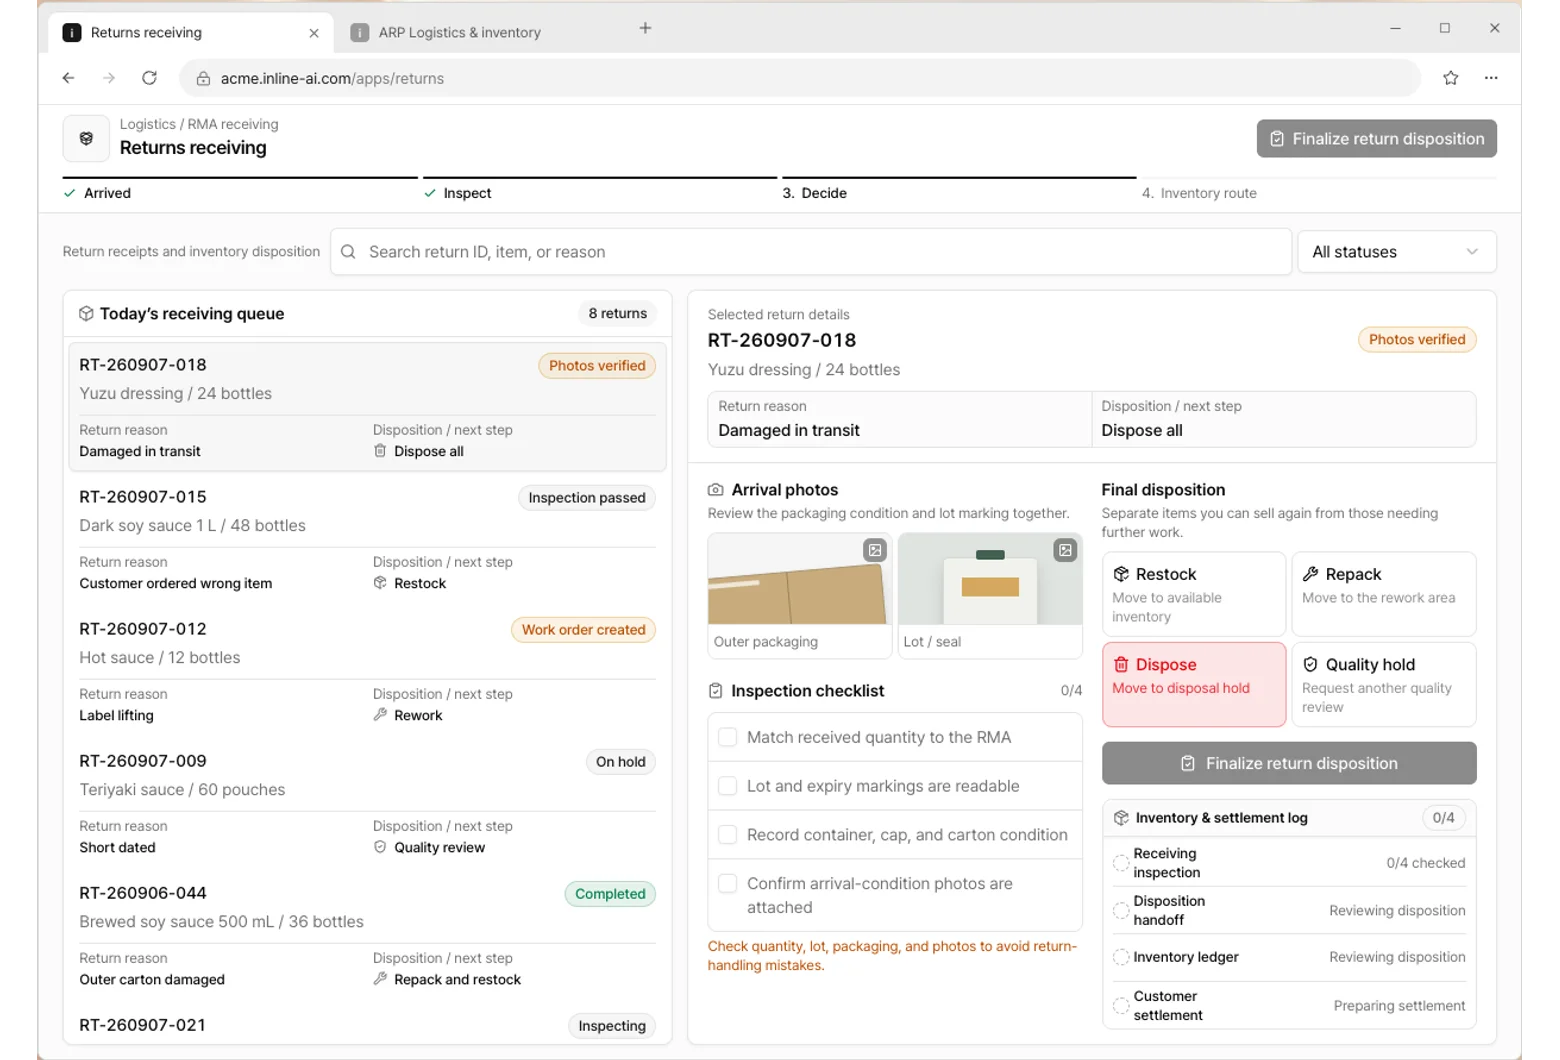
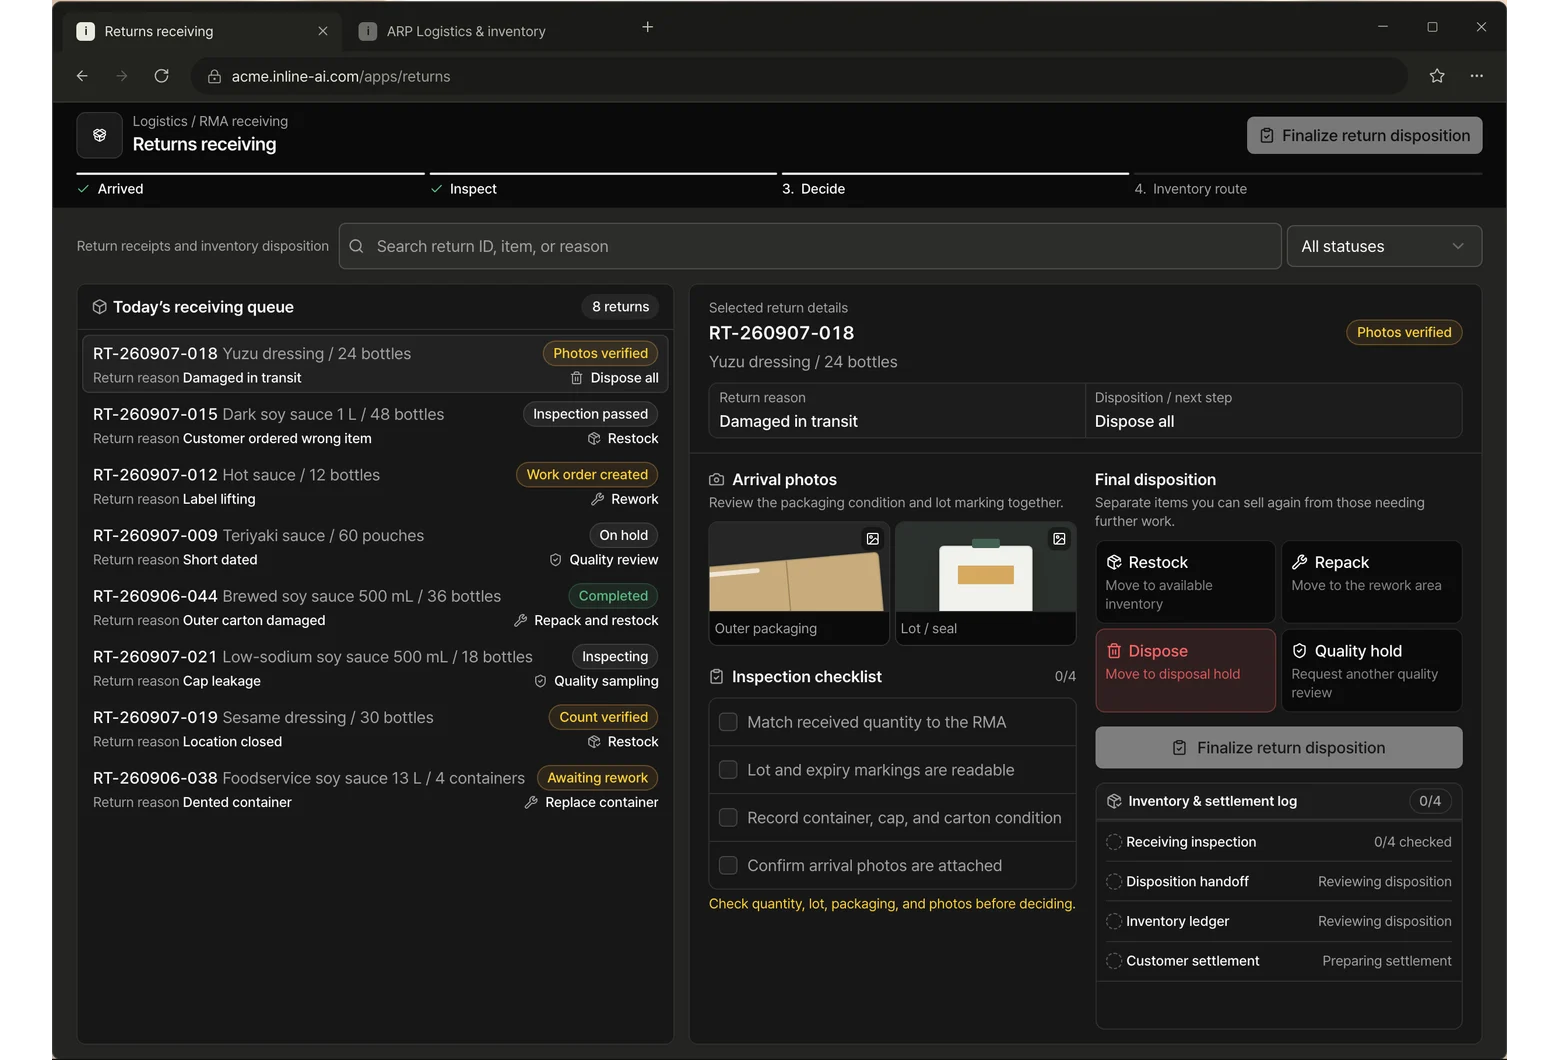
Inspect incoming returns and route them to restock, rework, or disposal.