Blog
How to Calculate Percentage in Excel: Basic %, Growth Rate, and Share of Total
 Mike Yi · Mar 24, 2026
Percentages feel like the most basic thing in a spreadsheet, right up until your number comes back as 8000%, or as a flat 0.8 that refuses to turn into 80% no matter what you do. The math is simple. The part that trips people up is that Excel treats the value and the way it is displayed as two completely separate things.
This guide walks through how to calculate percentage in Excel from the ground up: the basic formula, the percent format that bites everyone at least once, year-over-year growth rate, share of total, and the handful of mistakes that make percentages come out wrong even when your formula is correct.
The Basic Percentage Formula in Excel
At its core, a percentage is just one value divided by a total. If 80 out of 100 ordered items were delivered, you divide 80 / 100 to get 0.8, and that is 80%.
The pattern in Excel is always the same: part ÷ whole. In the sheet below, the delivered count sits in column C and the ordered count in column B, so the formula is simply =C2/B2.
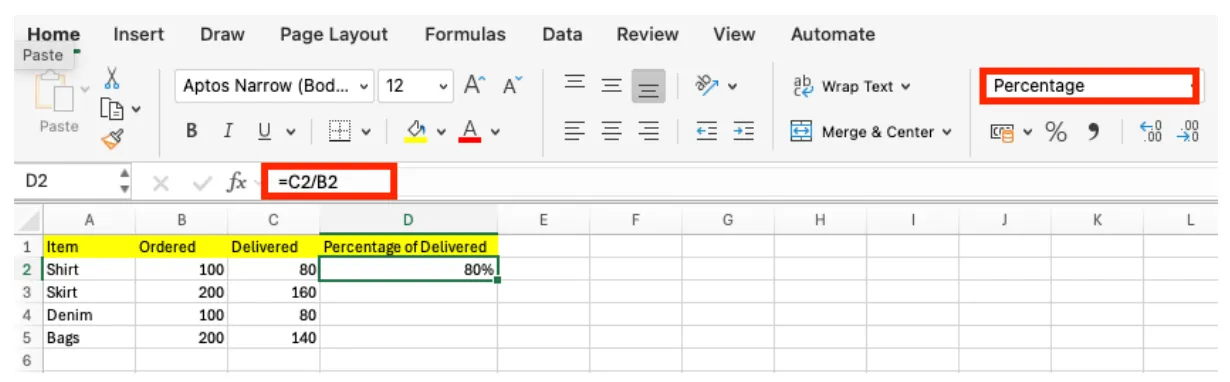
The result lands as 0.8 first, and only looks like 80% once you apply the percent format. That order matters: in Excel you calculate first, then format. Mixing those two steps up is the root of almost every "my percentage is wrong" problem.
Percent Format: Why 0.8 and 80% Are the Same Number
Here is the single most important idea in this whole article: the percent format changes how a number looks, not what it is.
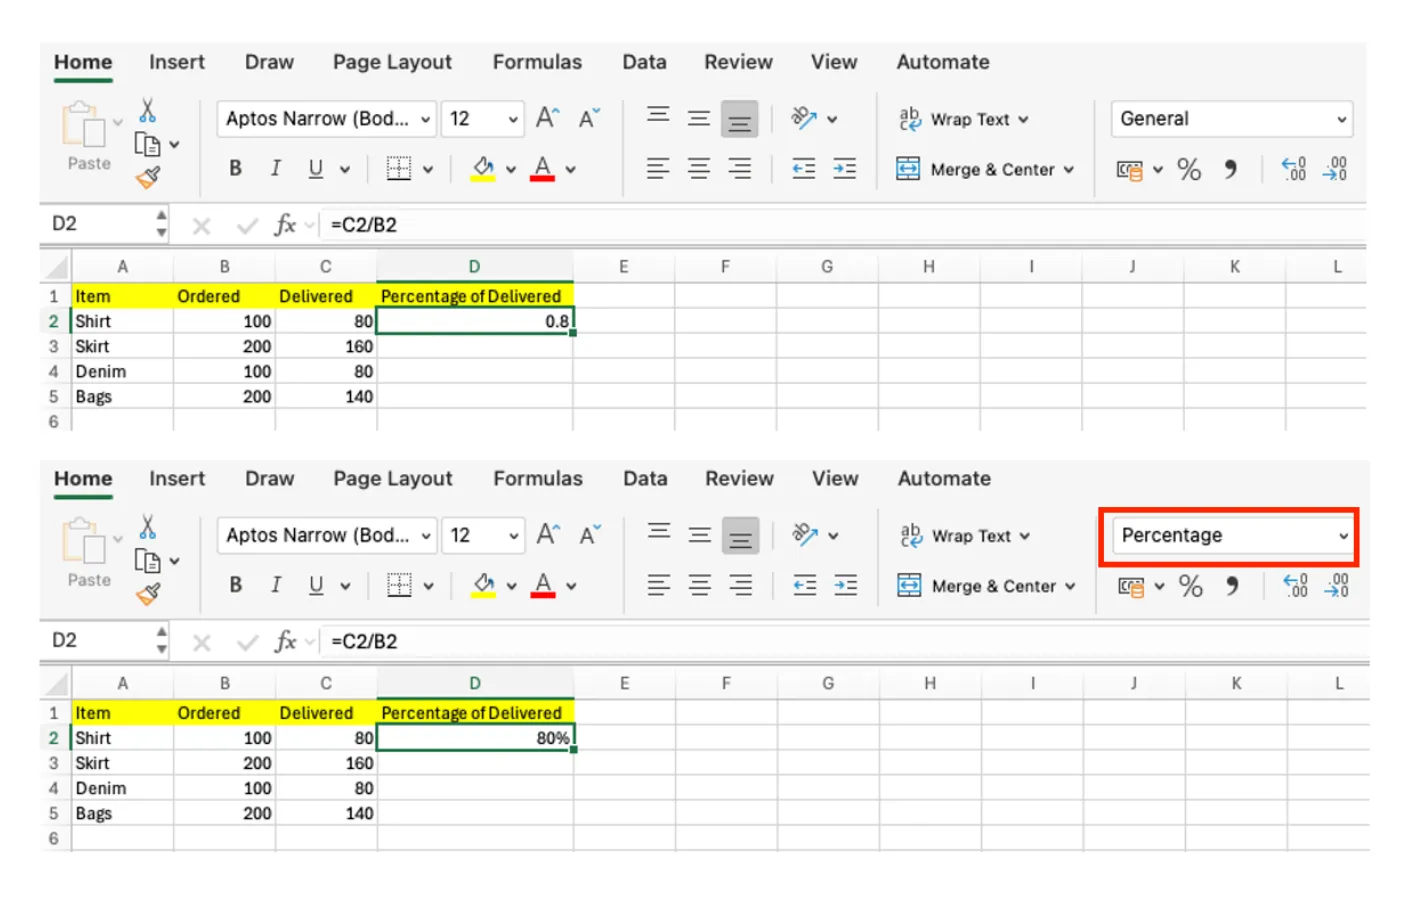
The cell on top shows 0.8 in the General format. The cell on the bottom shows 80% after clicking the percent button on the Home tab. Same underlying value, two different displays. Excel is just multiplying the stored 0.8 by 100 and adding a % sign for you on screen.
Once that clicks, two classic bugs disappear:
- Your percentage will not change. If a cell already carries the percent format and you type
0.8, you may see80%while another cell shows0.8as80%too. The fix is to check the cell format first, not the formula. - You get a giant number like
8000%. This usually means you multiplied an already-formatted percentage by 100 again. The value was fine, the extra* 100was not.
When a percentage looks off, look at the cell format before you touch the formula. Nine times out of ten that is where the problem lives.
How to Calculate Growth Rate (Year-over-Year, Month-over-Month)
The percentage you will actually use most at work is a growth rate: how much something went up or down compared to a previous period. The formula is:
(current value − previous value) ÷ previous value
Say 2025 revenue is in column B and 2024 revenue is in column C. The year-over-year growth for the first row is =(B2-C2)/C2.
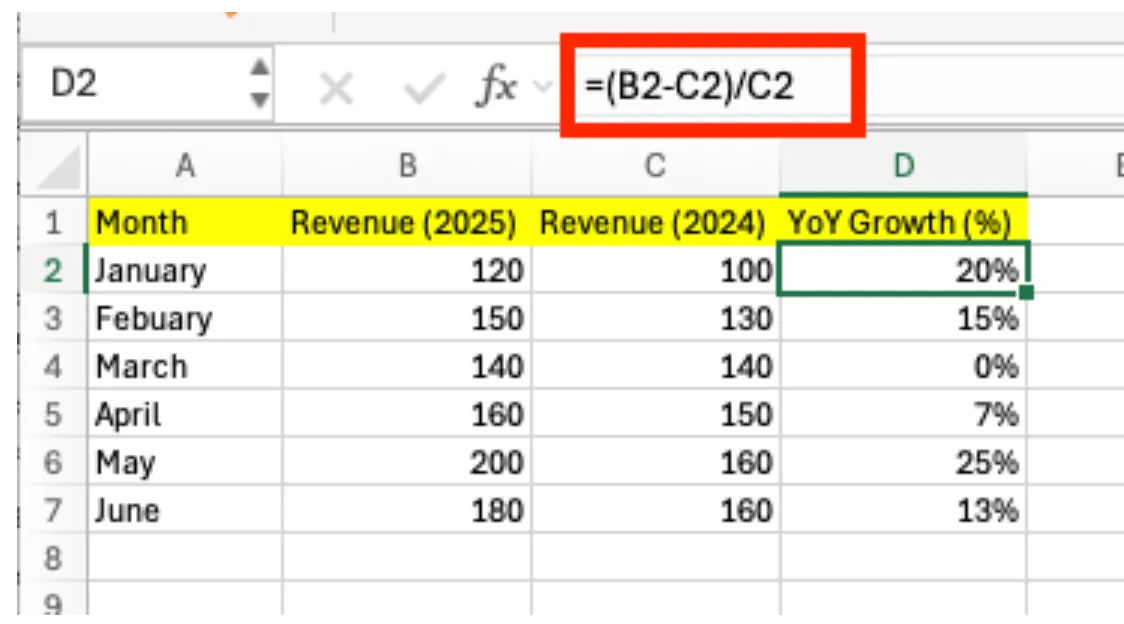
In the example, January goes from 100 in 2024 to 120 in 2025, so the growth rate is 20%. March stays flat at 140 both years and correctly returns 0%. Month-over-month works exactly the same way; you just point the "previous value" at last month instead of last year.
The one thing to burn into memory: you always divide by the previous value, not the current one. Flip those two and your growth rate is not just wrong, it is meaningless. This single mix-up is the most common reason a growth column comes back with numbers that make no sense.
Share of Total: Percentage of the Whole
The other everyday percentage is share of total: what slice of the whole does each row represent? Think revenue by month, sales by product, or budget by department. The formula is:
individual value ÷ grand total
In Excel, you divide each value by the sum of the column. To keep the total fixed as you copy the formula down, you can sum the whole column with SUM:
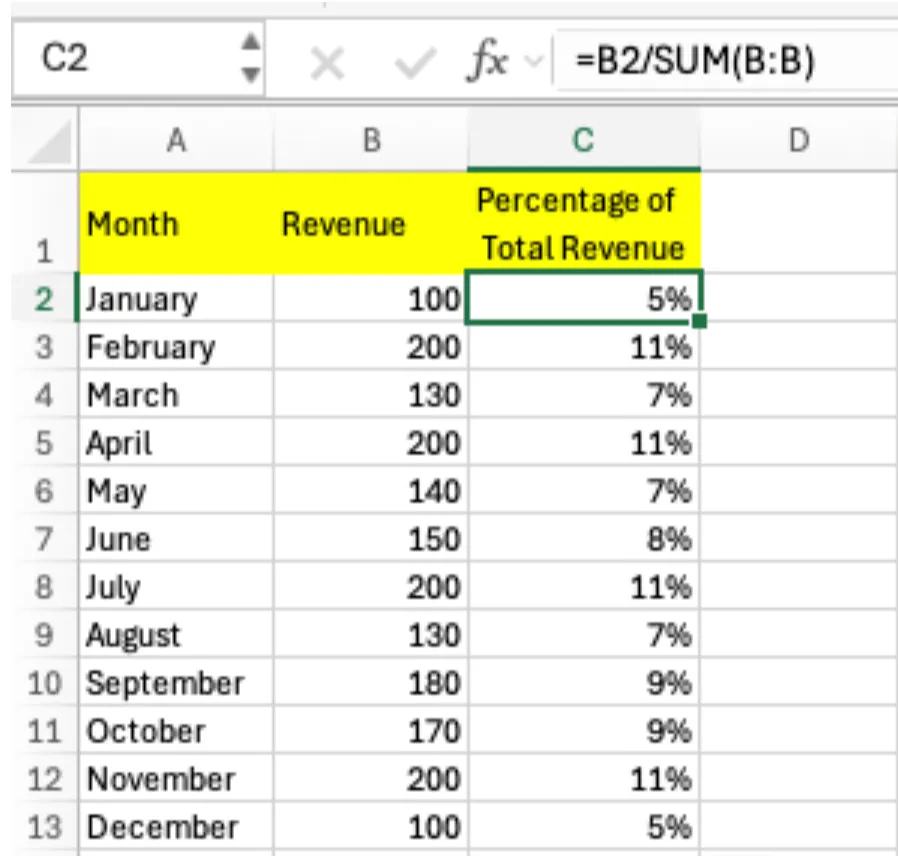
Here =B2/SUM(B:B) divides January's 100 by the total revenue across every month, returning 5%. Copy it down and each month shows its share of the year. This one formula powers most of the "what percent of the total" analysis that marketing, sales, and finance teams run every single week.
If you find yourself comparing these shares against group averages, the AVERAGE function pairs naturally with this kind of breakdown.
Why Your Percentage Comes Out Wrong
When percentages misbehave, it is almost never the arithmetic. It is one of these three:
- You are checking the formula instead of the format. A value that looks wrong is often formatted wrong. Confirm whether the cell is set to Percentage before assuming the math failed.
- The value did not change, only the display did. Applying the percent format never alters the stored number. If the result looks off after formatting, the underlying value was already off.
- The result is over 100% by accident. A percentage above
100%is usually a wrong denominator, especially in growth-rate formulas where the "previous value" got swapped for the current one. Recheck what you are dividing by before anything else.
Get the format and the denominator right, and percentages stop being mysterious.
A Faster Way to Handle Percentages in Excel
Knowing the formulas is one thing. Typing the same =C2/B2, =(B2-C2)/C2, and =B2/SUM(B:B) across dozens of rows, then setting the percent format on each one, is the part that quietly eats your afternoon, and it only gets worse as the data grows.
That is where inline AI helps. It reads your table structure automatically and builds the percentage, growth-rate, and share-of-total formulas for you, formatting included, so you never type a division by hand again. Ask in plain English, and it figures out the right denominator and applies the result in real time.
It runs locally on your PC, so your data stays on your machine with nothing uploaded to the cloud, and it ranks #1 on SpreadsheetBench with 92% accuracy.
If percentages are eating into your day, let inline AI handle the repetitive setup so you can focus on what the numbers actually mean.
Download your AI Coworker for Excel