

Loading...
Start with a demo built on your own data.
Book a demoEight areas, from bookings and production to quality, working capital, and staffing, sit next to their goals. Every signal that drifts off target shows its cause and owner, and the owner can assign an action or email a summary on the spot.
Morning operating briefLive
Operating read
4 signals need executive attention
8:30 AM close / 8 operating areas
Month-to-date revenue
$3.31M
+4.6% vs plan
Operating margin
12.8%
Estimate before cost close
Cash available
$2.46M
76 days of operating spend
On-time delivery
96.8%
+1.8 pts above target
6 close trend / endpoint is current
| Operating area | Actual / goal |
|---|---|
Peak Market annual contract | $588K/ $534K |
45 min filler service | 62,480 units/ 64,000 units |
Line 3 seal adjustment | 1.42% defects/ ≤ 1.50% |
Collections 2 days slower | 52 days/ 50 days |
Night packing recruiting | 4 openings/ ≤ 3 openings |
Hotel renewals increased | 91.4% repeat rate/ ≥ 90.0% |
Forklift route redesigned | 184 days incident-free/ 365 days |
Soybean oil spot increase | +2.7% input cost/ ≤ +2.0% |
Selected signal
Today's driver
Peak Market annual contract
Mia Carter / Revenue
Lock rollout dates for the annual contract
Today's calls and next checks
Recovery production scheduled
Production / 1,520 units / ship plan held
Soybean oil fixed-price quote requested
Procurement / 60-day volume / review at noon
Line 3 shipments resumed
Quality / 40 seal samples passed
Attainment under 95% of goal
Attention signalAny metric below 95% of target gets a warning flag.
At 8:30 AM every day, what changed yesterday lands in your inbox.
Order work such as a recovery run
Give an instruction and it reaches the production team right away.
This app was built by describing it. Answer a few questions and get an app you can use the same day, no developers needed.
Explore App builderEvery morning I want one screen that tells me whether we're on plan and where to look.
Found 4 ARP modules. A few questions first.
Which areas should it cover?
Bookings, production, quality, working capital, staffing, customers, safety, purchasing
When is margin final?
Show an estimate before the cost close, and the final figure after it
How should the reports be tailored?
An overall summary for leadership and action items for each department head
Your app is ready to use.
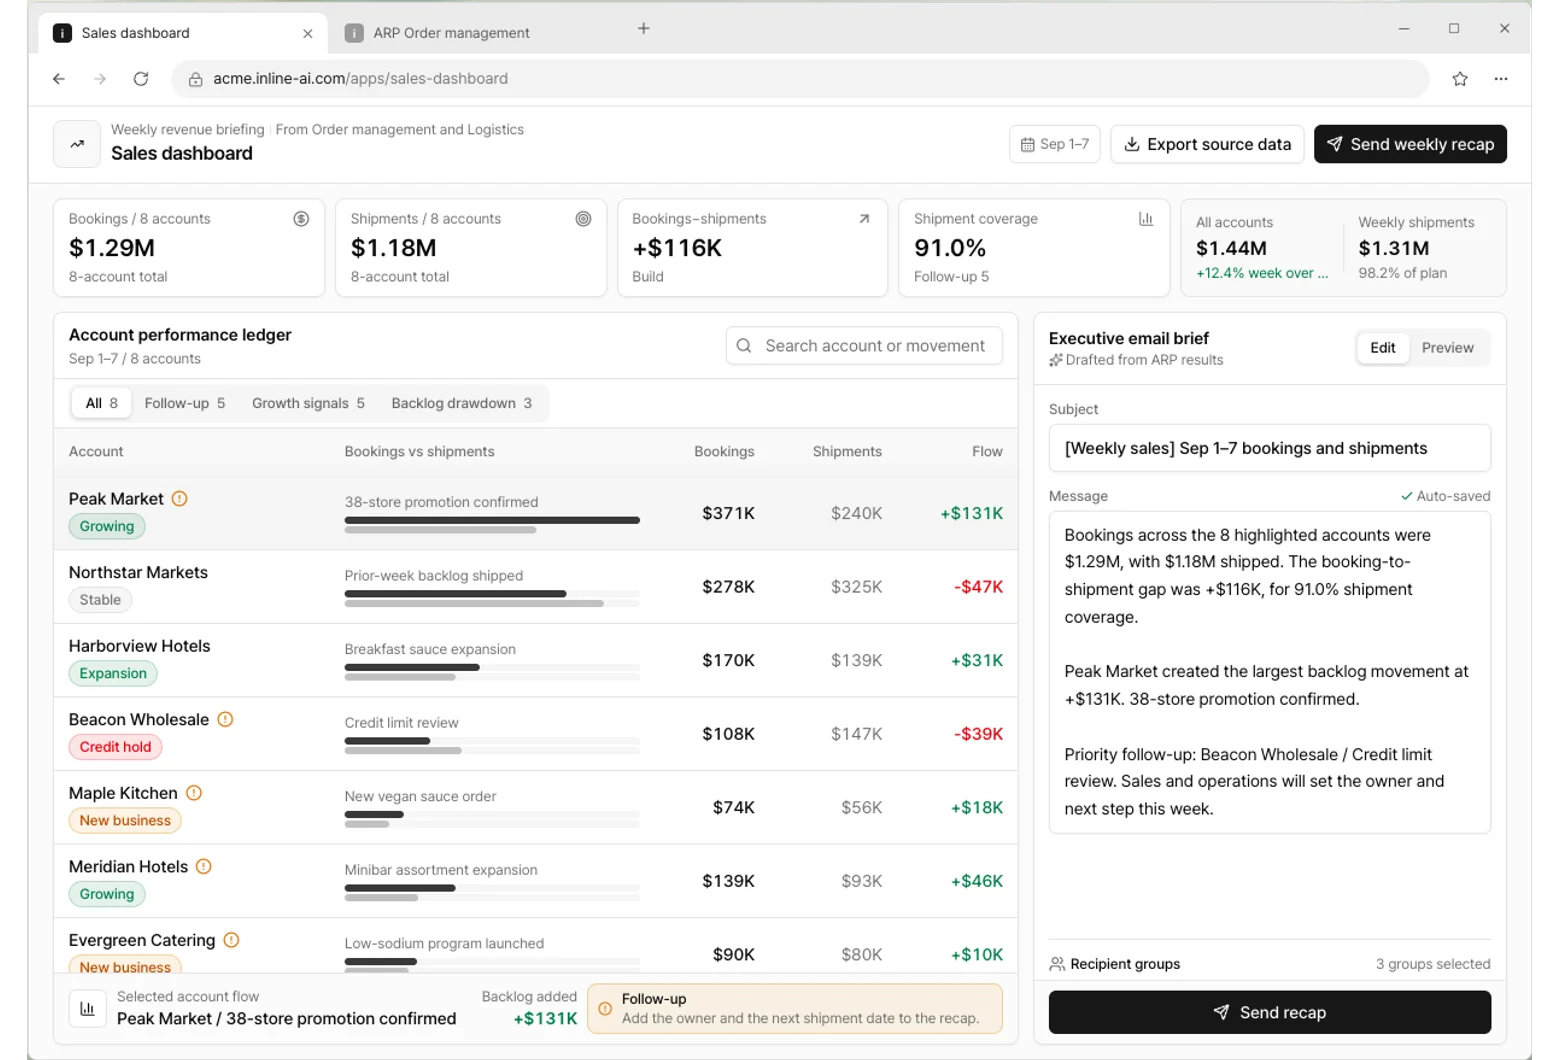
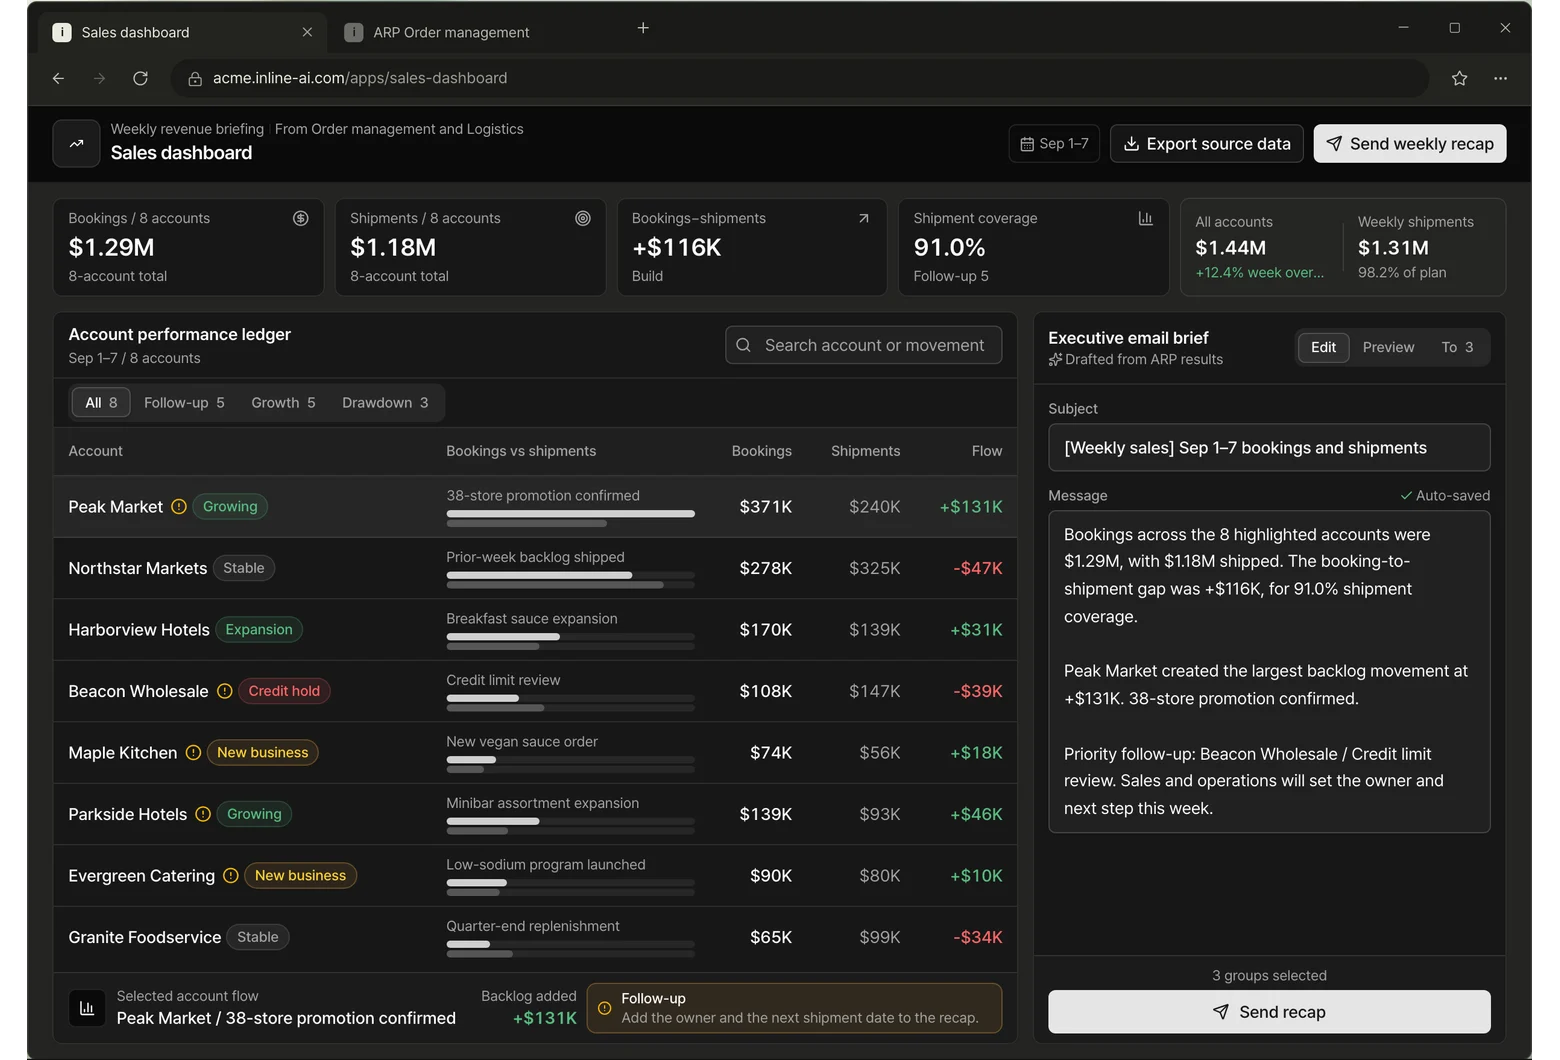
Last week's bookings and shipments by customer, plus the Monday recap email.
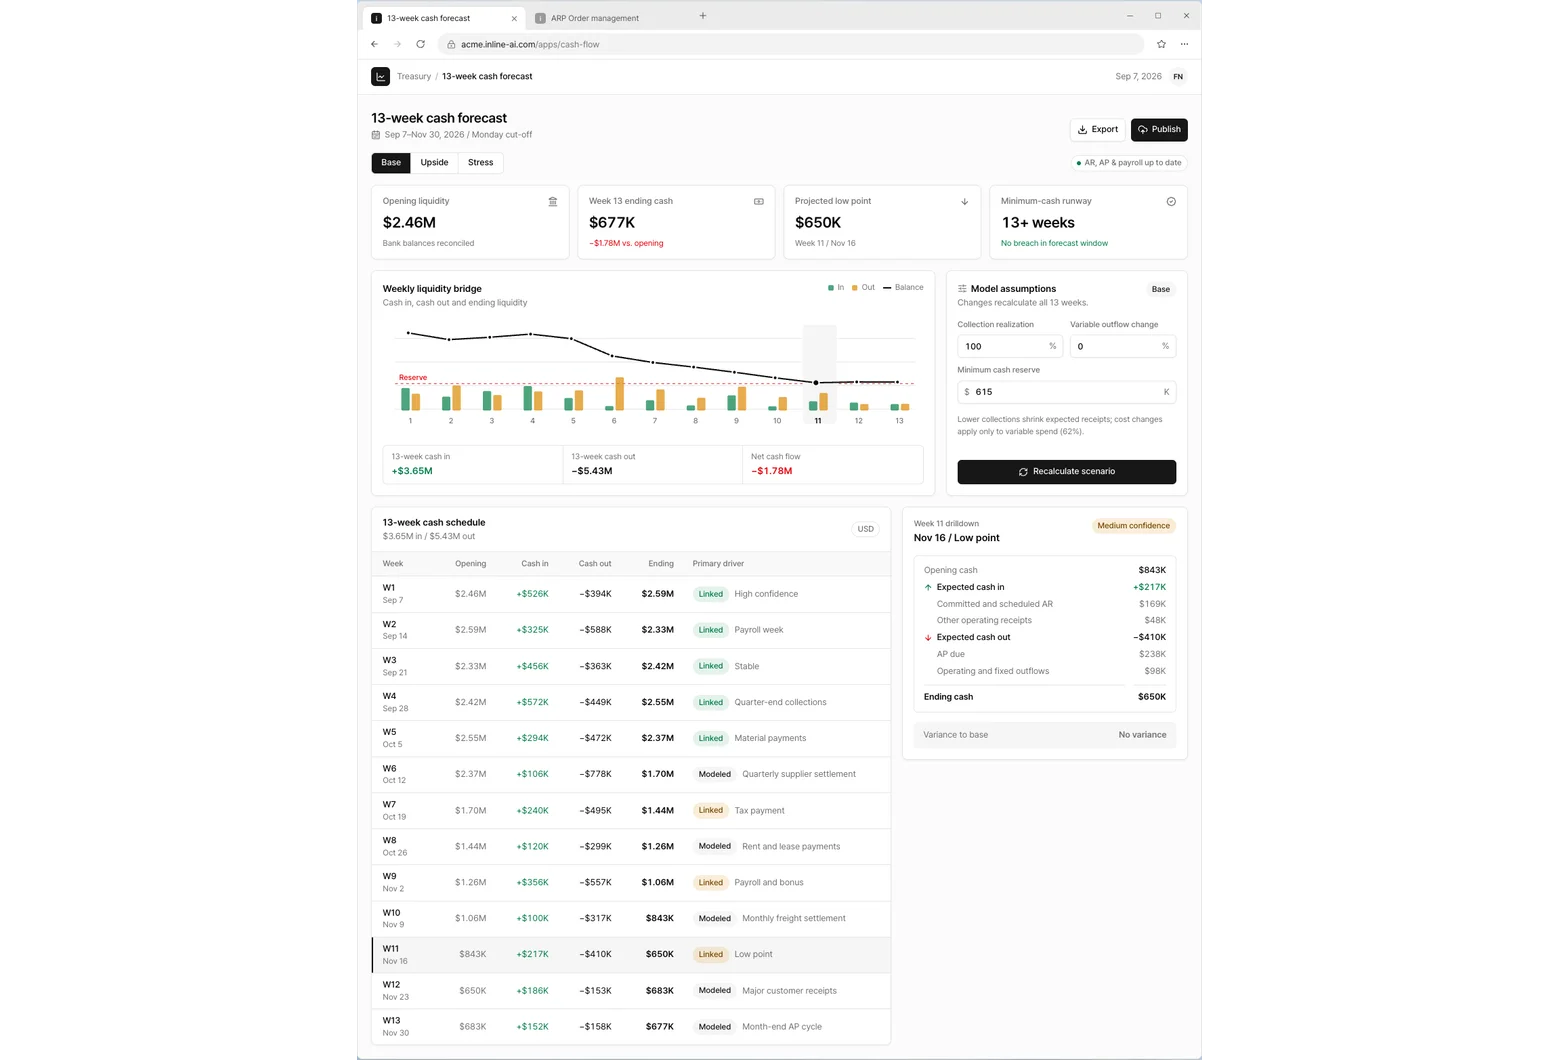
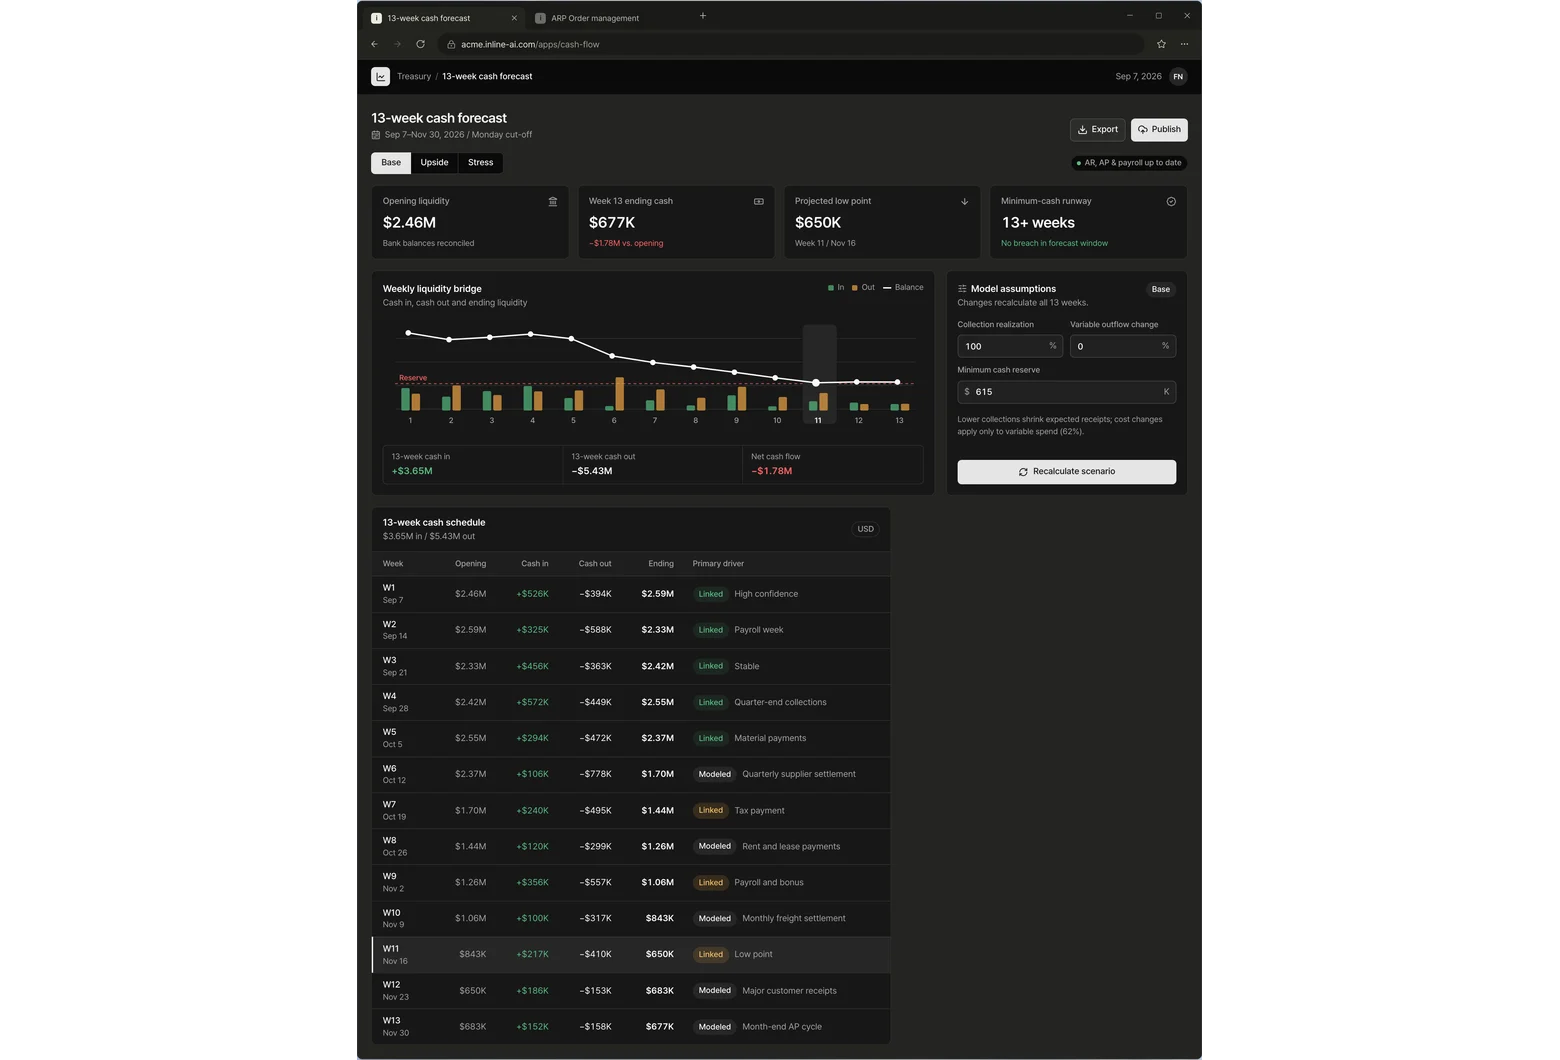
Project 13 weeks of cash and spot the weeks that run short.
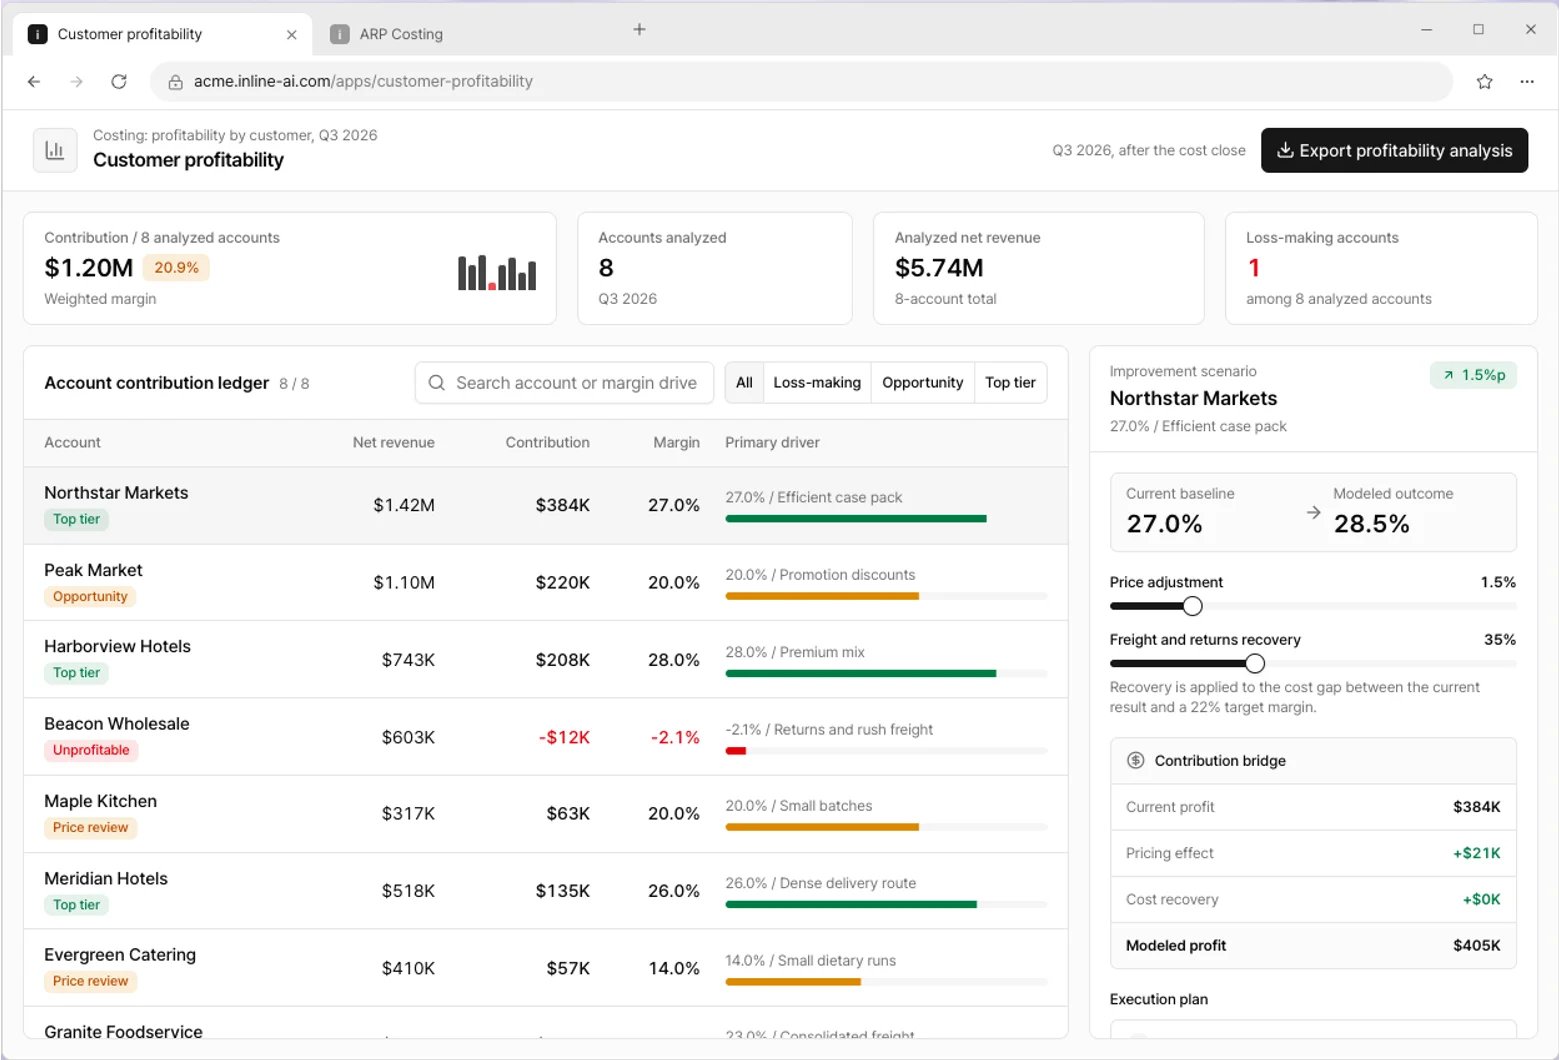
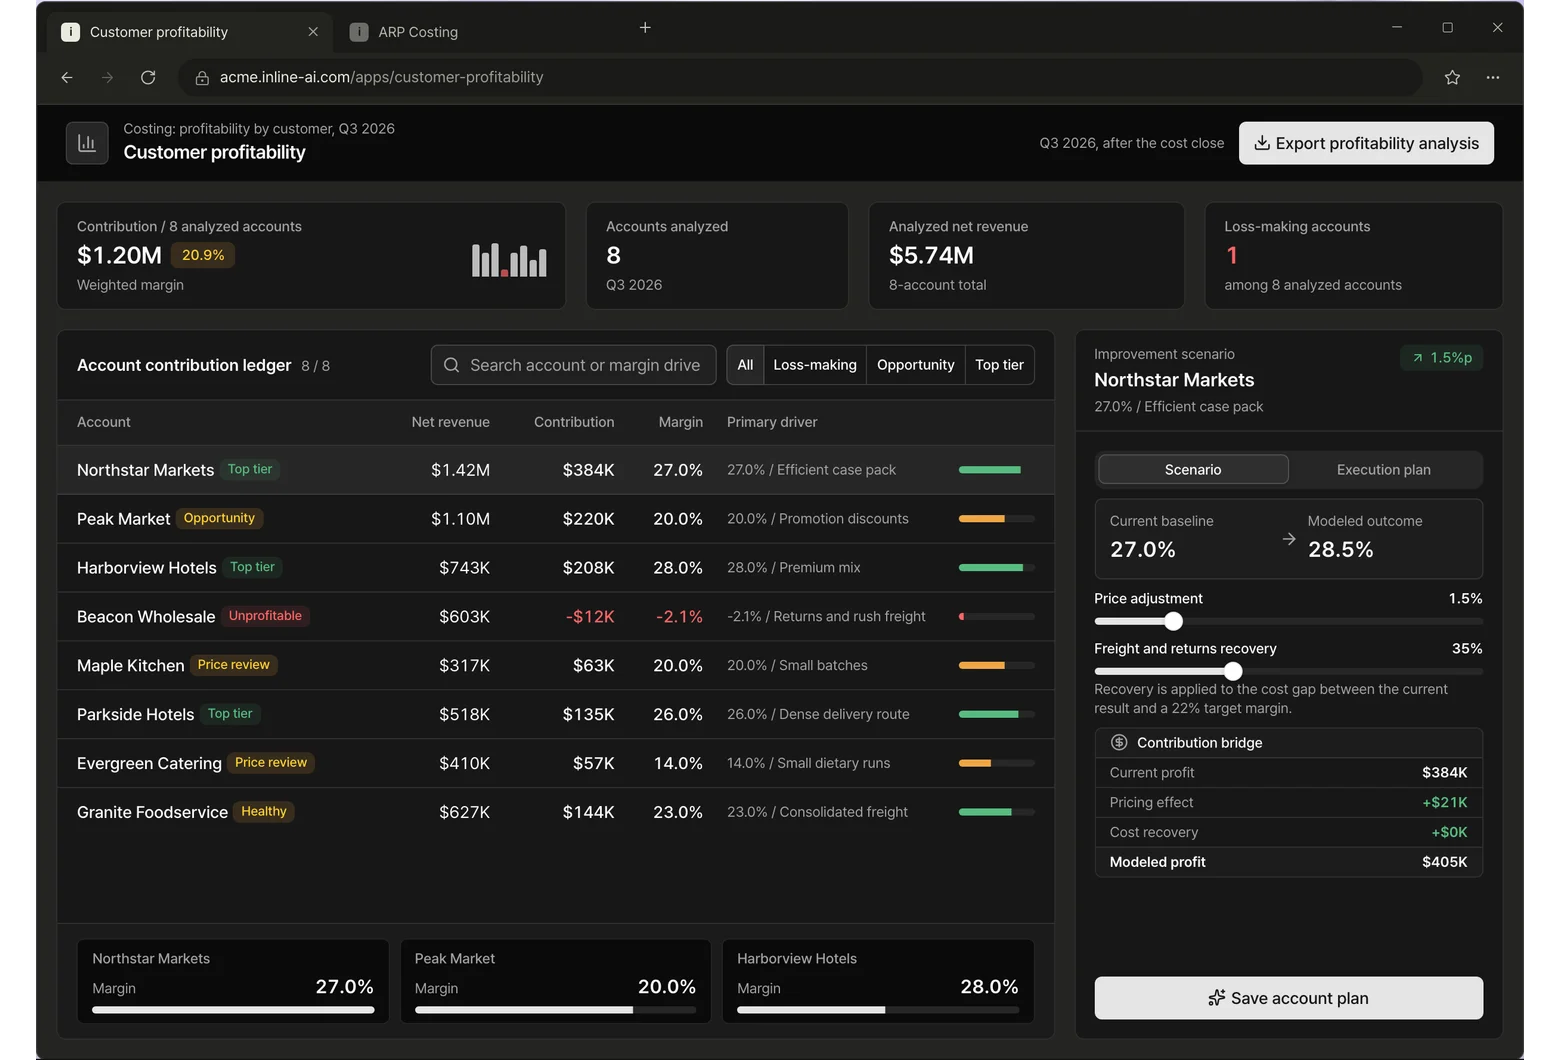
Contribution by customer after cost of goods, freight, returns, and discounts.