
Loading...
Grow the business. Let operations keep up.
Start with a free workflow assessment and a tailored demo.
Get a free assessmentStart with a free workflow assessment and a tailored demo.
Get a free assessmentDefect rates are tallied per line from production results and in-process inspections. When a line crosses the control limit, you see the input lot and defect type with it, and record the investigation from the same screen.
1.26%
1
384
$2.52K
| Production line | Input lot | Defect type | Defect rate | Disposition |
|---|---|---|---|---|
| M260907-04 | Viscosity drift | 0.62% | In control | |
| P260907-11 | Temperature variance | 0.18% | In control | |
| F260907-08 | Cap seal | 3.84% | Immediate action required | |
| L260907-06 | Label position | 1.16% | Watch | |
| B260907-03 | Carton crush | 0.71% | In control | |
| C260907-09 | Barcode readability | 0.94% | Watch | |
| W260907-12 | Underweight units | 0.37% | In control | |
| S260907-14 | Film tears | 2.26% | Effectiveness verified |
Selected line diagnosis
Defect Pareto
Line defect rate > 3.0%
Over limit, show input lotPast 3.0%, the line is flagged along with the input lot behind it.
Over-limit lines are emailed to the quality lead right away.
Quarantine the bad lot
AI finds high-defect lots and quarantines them right away.
This app was built by describing it. Answer a few questions and get an app you can use the same day, no developers needed.
Explore App builderI want defect rates by line as they happen, and when one crosses the limit, to know which material lot went in.
Found 2 ARP modules. A few questions first.
What control limit should apply?
3.0% for every line, with an alert as soon as it's crossed
How should defect causes be grouped?
Seal, fill, label, visual, dimension, packing
Who should hear about rising defects?
The quality manager and line lead
Your app is ready to use.
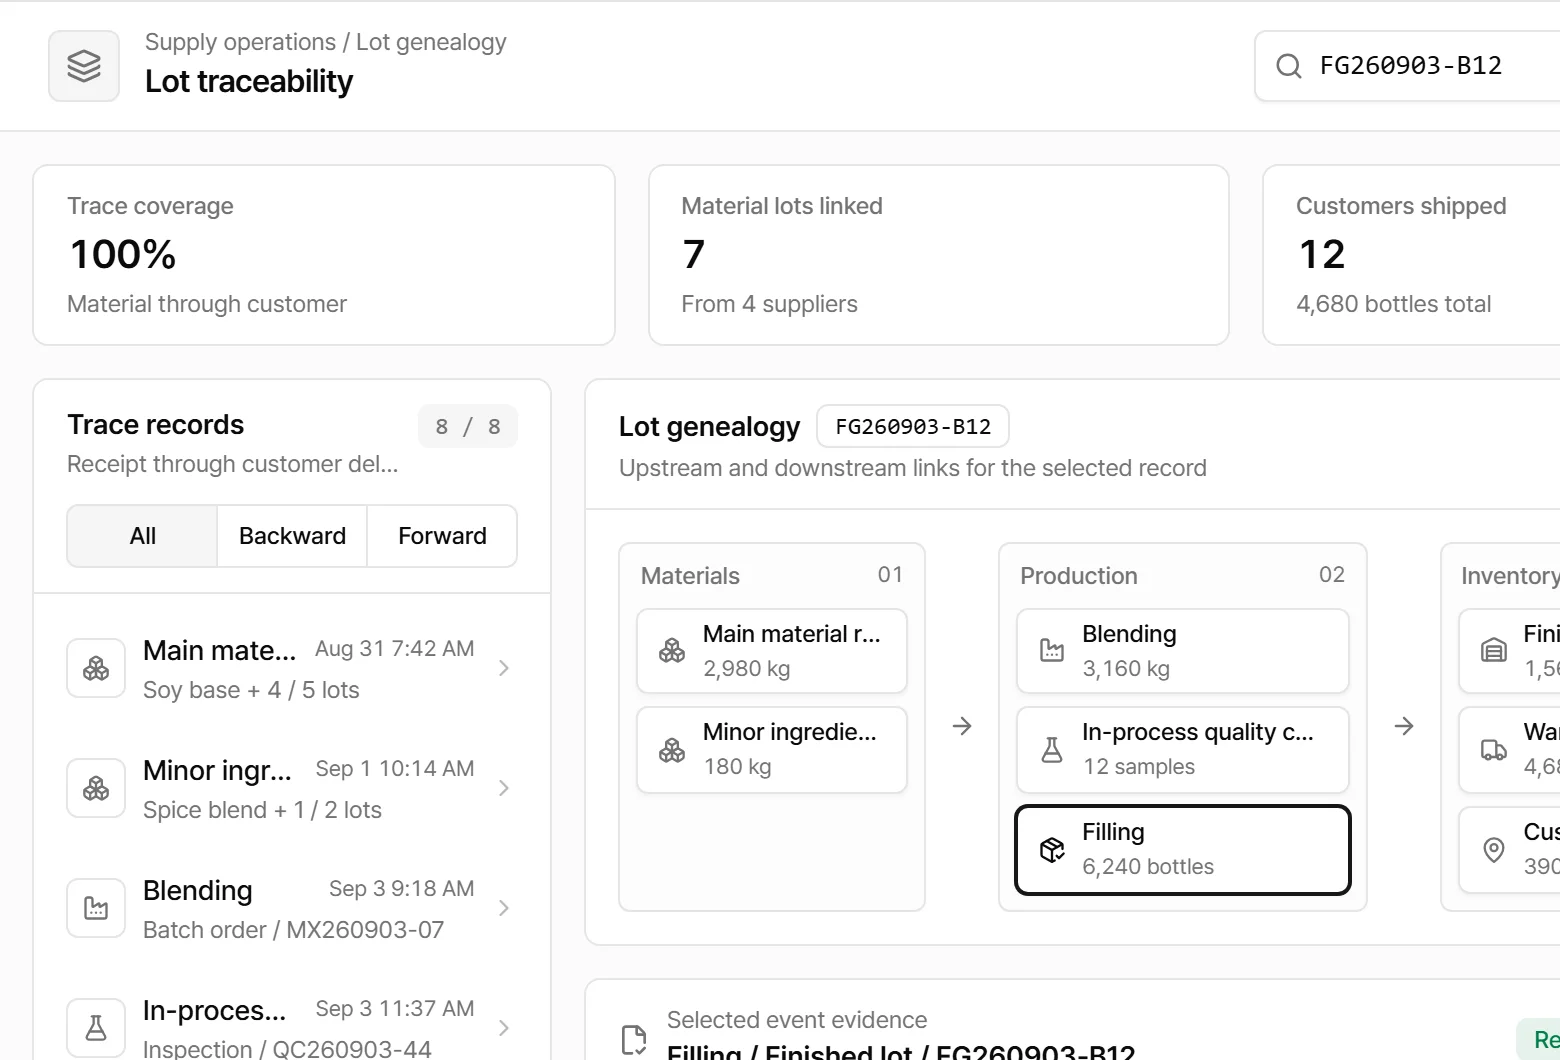
Trace one finished-goods lot back to its materials and forward to every customer.
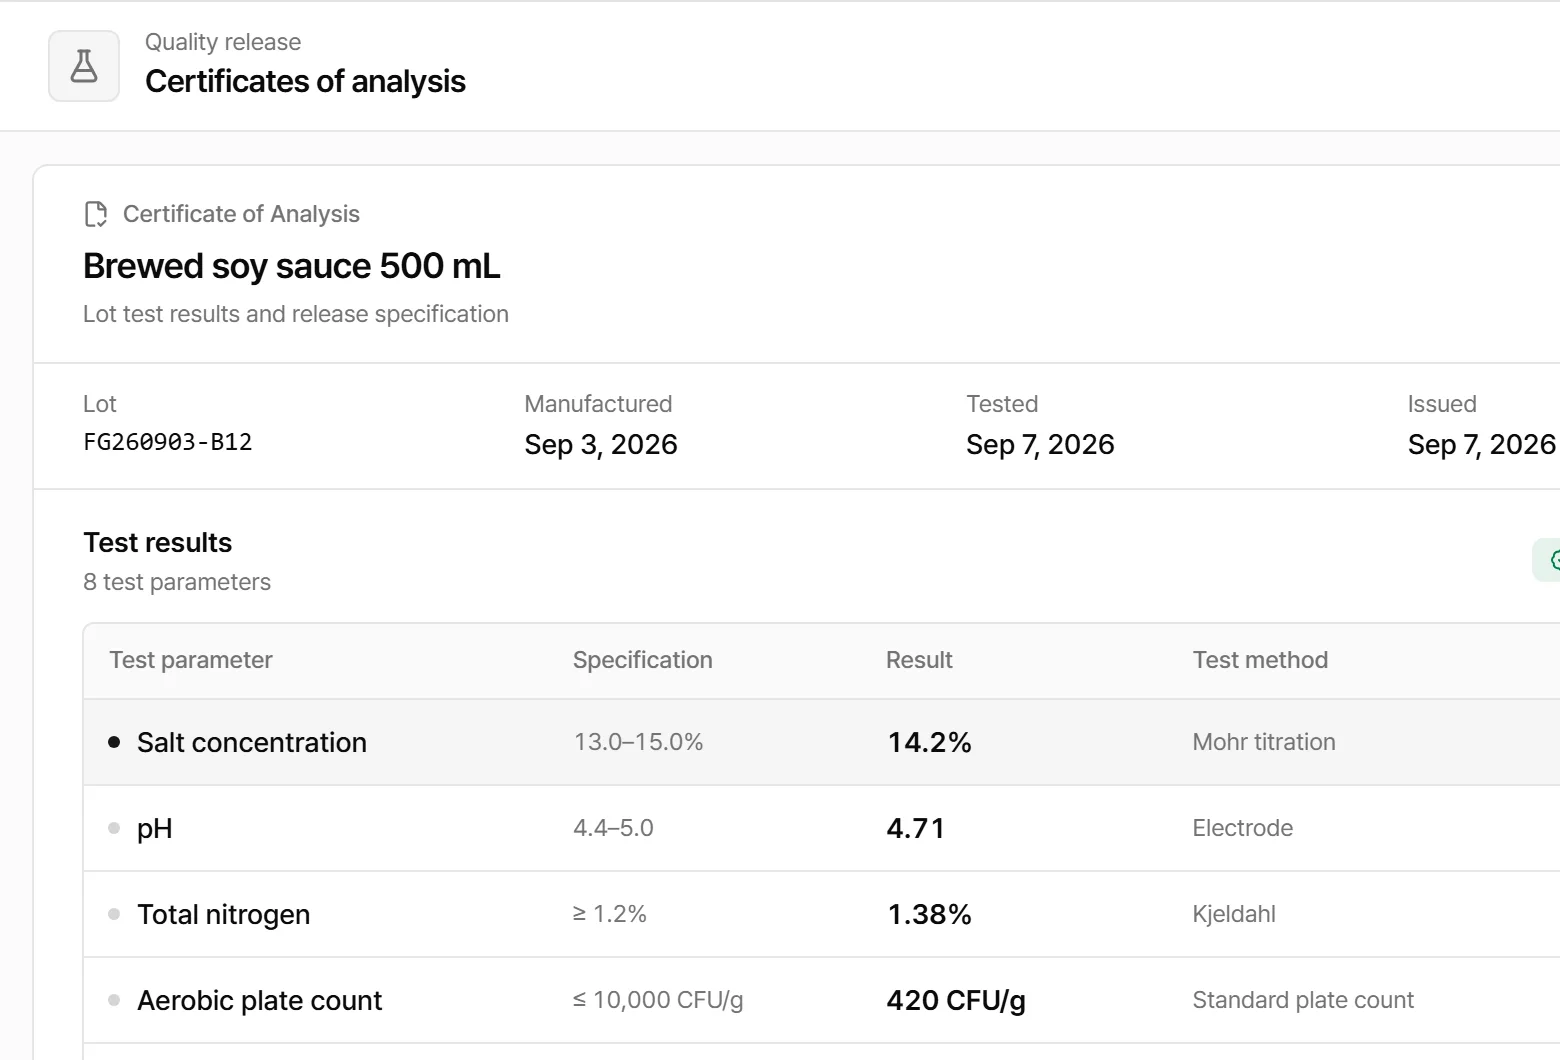
Enter inspection results, and a certificate draft is ready for each lot.
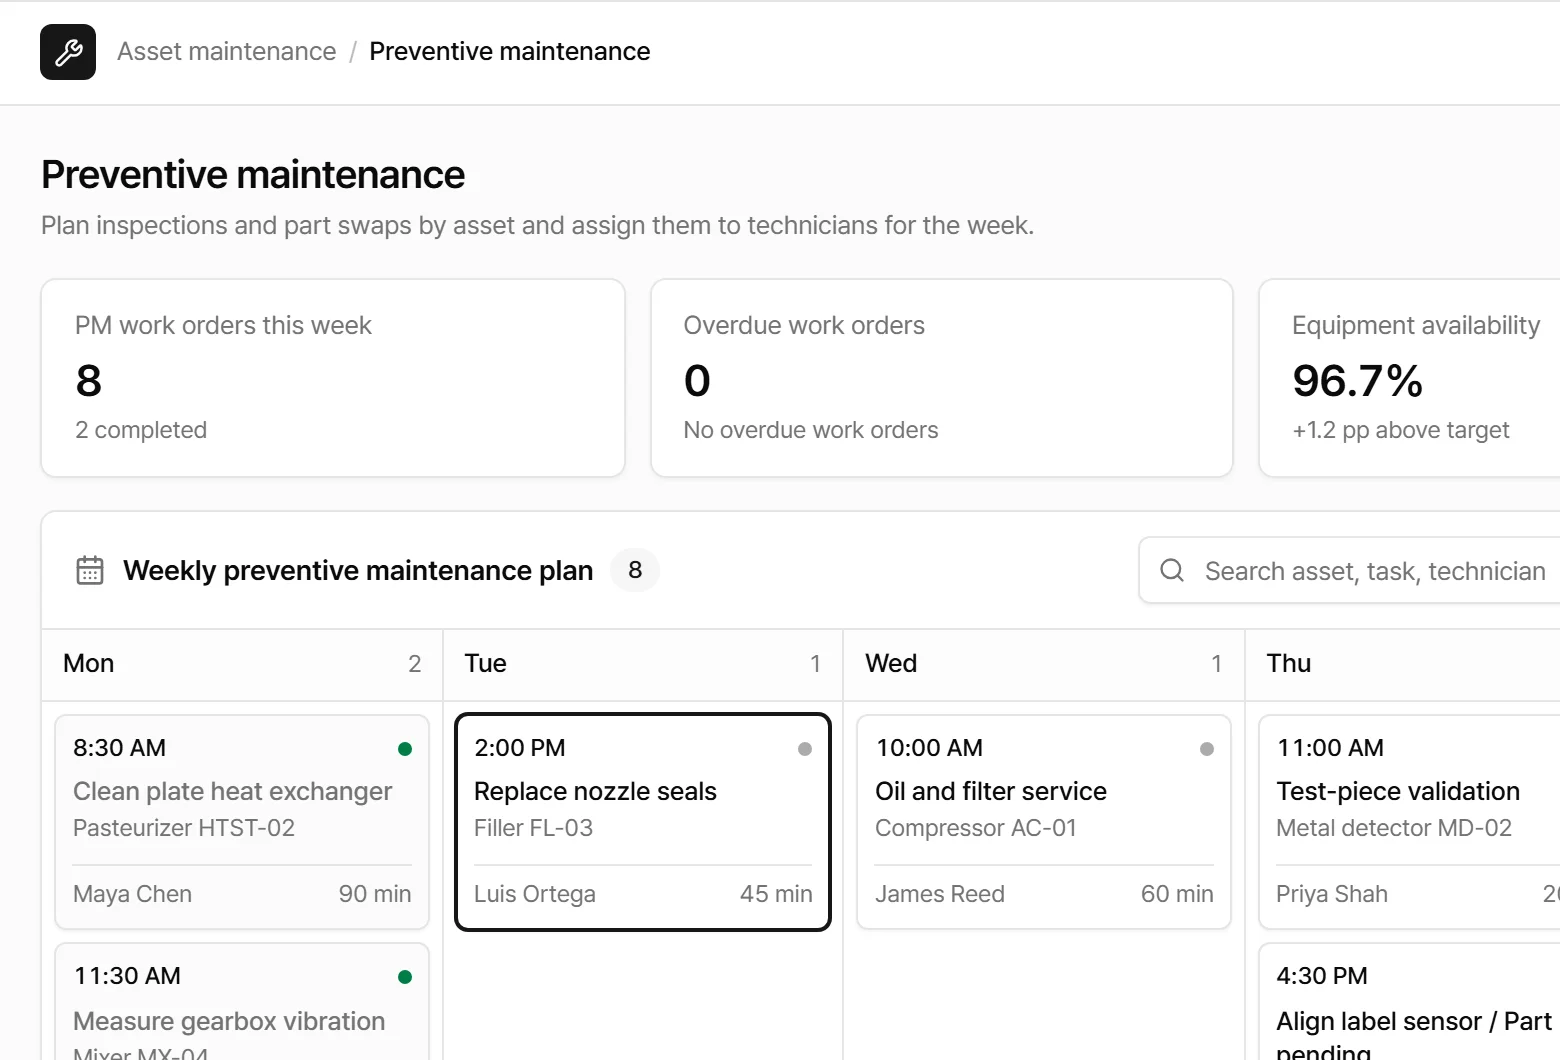
Each machine has a service interval, and this week's maintenance plan lives on one screen.